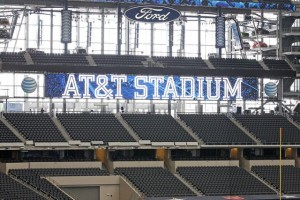
Cowboys hit 2+ TB, Texas A&M sees 1.8+ TB in first AT&T DAS stats for 2016 football season

dx1With the first few football games of the season now under our belts, stats from stadium wireless networks are filtering in with a refrain we’ve heard before: Fan use of wireless data is still growing, with no top reached yet.

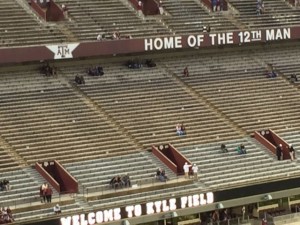
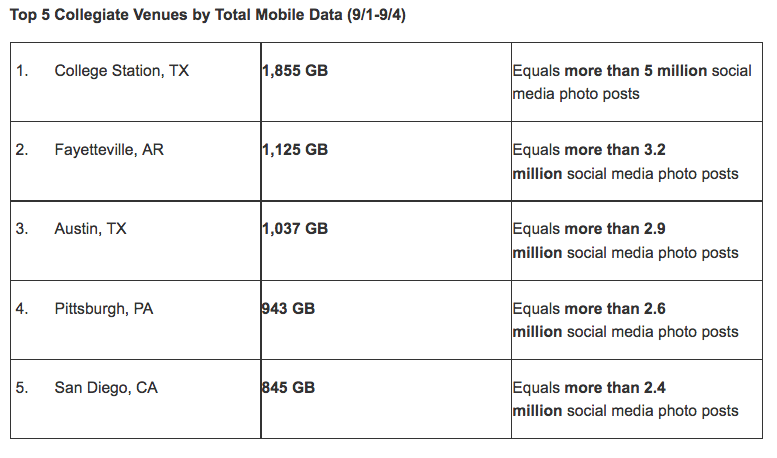
Thanks to our friends at AT&T we have the first set of cellular network stats in hand, which show a report of 2.273 terabytes of data used on the AT&T network at AT&T Stadium for the Cowboys’ home opener, a 20-19 loss to the New York Giants on Sept. 11. That same weekend the AT&T network at Kyle Field in College Station, Texas, home of the Texas A&M Aggies, saw 1.855 TB of data during Texas A&M’s home opener against UCLA, a 31-24 overtime win over the Bruins.

Remember these stats are for AT&T traffic only, and only for the AT&T network on the DAS installations in and around the stadiums. Any other wireless carriers out there who want to send us statistics, please do so… as well as team Wi-Fi network totals. Look for more reports soon! AT&T graphics below on the first week results. We figure you can figure out which stadiums they’re talking about by the town locations.
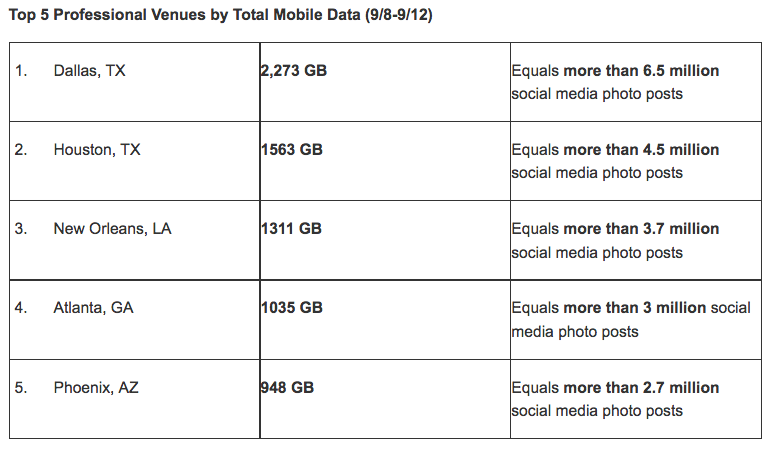
Screen Shot 2016-09-19 at 11.21.50 AM

Screen Shot 2016-09-19 at 11.21.58 AM

Fan-facing Wi-Fi on hold as Coliseum gets ready for Rams’ return to Los Angeles

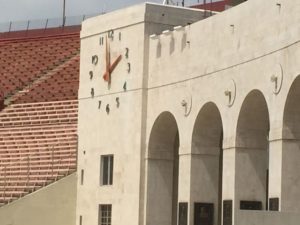
DAS antennas visible on the LA Coliseum's facade

DAS antennas visible on the LA Coliseum’s facade

Normally when a new professional sports franchise comes to town or opens a new venue, preparations move into overdrive pretty quickly — especially for infrastructure like luxury suites, Wi-Fi and DAS.

But this is the Los Angeles Rams, and nothing about the team’s trajectory is normal, including the technology. So after making good on a longstanding threat to move the team from St. Louis, owner Stan Kroenke in January broke ground on a new, $2.6 billion “NFL Disneyland” venue in the LA suburb of Inglewood. It’s expected to be ready in time for the 2019 season. So for right now, the returning Rams will play at the Los Angeles Coliseum.

While it has an established and robust DAS system, the Coliseum has no dedicated, fan-facing Wi-Fi network, just as the Edward Jones Dome in St. Louis didn’t. But it’s LA, baby. Kanye. Jack. Celebrity sightings means more bandwidth is needed, not less. But the first appearance of Wi-Fi at the venerable Coliseum won’t be for fans, but for operations.

Relying on DAS for fan wireless

Editor’s note: This profile is from our most recent STADIUM TECH REPORT, the Q2 issue which contains a feature story on Wi-Fi analytics, and a sneak peek of the Minnesota Vikings’ new US Bank Stadium. DOWNLOAD YOUR FREE COPY today!

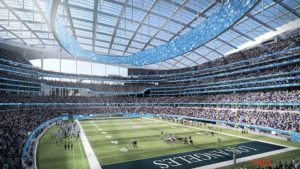
Artist rendering of the proposed new LA football stadium

Artist rendering of the proposed new LA football stadium

So when the Rams play their first pre-season game at the Coliseum in August against the Dallas Cowboys, fans will have to rely on the DAS network for connectivity. AT&T, Verizon Wireless and more recently T-Mobile, are the DAS carriers; Sprint trucks in a COW for USC games.

The Rams will bring in their own Wi-Fi for communications to and from the sidelines, along with their Microsoft Surface tablets, according to Derek Thatcher, IT manager at the Coliseum and an employee of USC, which oversees and administers the venue for Los Angeles County. There will also be private Wi-Fi in the locker rooms and the officiating rooms. Thatcher’s working closely with the Rams and the NFL, including one of the NFL’s frequency coordinators, to ensure everybody has the bandwidth they need.

Separate from the Rams and the NFL, USC is undertaking a major renovation of the Coliseum, home to the university’s storied football team. The $270 million project cost will be funded entirely by USC Athletics from capital gifts, sponsorship revenue, non-USC athletic events at the Coliseum, and donor naming opportunities. “The project will not require any student fees or general university, local, state or federal funds,” the university said on ColiseumRenovation.com.

In addition to significant expansion of luxury suites and press box facilities (which houses most the IT and networking gear for the Coliseum), USC will also be adding public Wi-Fi and is talking with different vendors about their requirements.

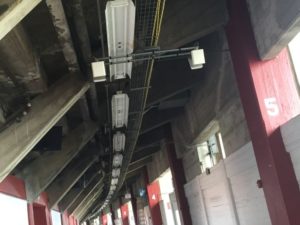
DAS antennas inside the concourse

DAS antennas inside the concourse

It is worth noting that Aruba Networks provides wireless networking for most of the adjacent USC campus (more than 5,000 APs), including the Galen Center and USC’s healthcare facilities. Thatcher emphasized the bidding was open to all vendors.

Waiting for the new stadium to be built

The Coliseum’s current capacity is 93,600 and the NFL will use 80,000 seats; post-renovation, capacity will be 77,500, due to replacement of all seats and addition of handrails to the aisles. That’s good news for Wi-Fi engineers, since the Coliseum’s bowl design has no overhangs to speak of; DAS antennas are mounted to poles that ring the stadium, and also above the bowl’s entry and exit tunnels. “Underseat AP design is expensive… we could end up with underseat and handrail,” Thatcher told Mobile Sports Report. “We’re looking at all possible solutions.”

The renovation is scheduled to begin right after USC’s 2017 football season ends and is expected to be done in time for the 2019 opener. The university said it will plan the construction schedule so that 2018 season can still be played at the Coliseum.

The other wild card in the Coliseum’s future is the Los Angeles bid to host the 2024 Summer Olympics. The city has already done the honors before (1932, 1984) and the Coliseum served as the Olympic Stadium both times; a third time hosting would be unprecedented. But because of LA’s experience, coupled with plenty of already-built sporting venues to handle a plethora of events and requirements, it was natural for the US Olympic Committee to turn to LA once Boston bailed.

The city’s bid includes $300 million for additional renovations to the Coliseum.

Rome, Paris and Budapest are also competing to host the games. The winner will be announced by the International Olympic Committee in September 2017.

Wi-Fi Analytics: Taking the first steps

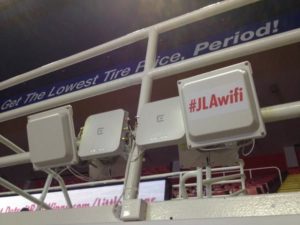
Wi-Fi antennas at Joe Louis Arena. Credit: Detroit Red Wings (click on any photo for a larger image)

Wi-Fi antennas at Joe Louis Arena. Credit: Detroit Red Wings (click on any photo for a larger image)

Even though the physical construction and deployment of a fan-facing Wi-Fi network seems like the biggest challenge facing a stadium’s information technology team, in reality everyone involved knows it’s just step one.

While turning on a live network is certainly a great accomplishment, once the data starts flowing the inevitable questions follow: Now that we have Wi-Fi, what do we do with it? And how do we find out who’s using it, why they are using it, and how can we use that information it to find out better ways to improve the fan experience while also improving our business?

Those “step two” questions can only be answered by analytics, the gathering of information about Wi-Fi network performance and user activity. And while almost every live network operator almost instantly uses performance numbers to help tune the system, plans to harvest and digest the more personalized information like end-user identification, application use and fan engagement are just getting started, even at the most technically advanced stadiums with Wi-Fi networks in place.

What follows here are some conversations with stadium tech professionals who are already running fan-facing Wi-Fi networks, exploring how they use Wi-Fi metrics and analytics to both enhance the game-day experience for fans while also building a base of information that can be used by both technical staffs and marketing organizations inside the team, school and venue organizations.

Even this small sample seems to suggest that while Wi-Fi networks may be somewhat pervasive in the larger stadiums across the country, the harvesting and processing of data generated by digital fan engagement is just getting started, with plenty of unanswered questions and experiments that have yet to bear significant fruit. Yet everyone we spoke with also had an unshakable confidence that getting metrics and analytics right was the key to wireless success over the long haul, and all are fully engaged in pursuing that goal. It may take longer than physical deployment, but the “step two” of learning from the networks is well underway.

Detroit Red Wings: Pushing past the initial learning curve

Editor’s note: This profile is from our most recent STADIUM TECH REPORT, the Q2 issue which contains a feature story on Wi-Fi analytics, and a sneak peek of the Minnesota Vikings’ new US Bank Stadium. DOWNLOAD YOUR FREE COPY today!

Now that the Wi-Fi network at Joe Louis Arena in Detroit is coming up on its second birthday, Tod Caflisch said network administrators can relax a bit on game nights. Early on, however, he remembers “babysitting” the network during games, watching live performance stats to make sure everything was working correctly.

Watching the live network performance statistics, Caflisch said, “I could tell if there were issues. If throughput looked a little flat, we might have to reboot a switch. It was important, because there was so much at stake.”

As former director of information technology for the NHL’s Detroit Red Wings (he recently left Detroit and is now with the Minnesota Vikings), Caflisch helped drive the deployment of an Extreme Networks Wi-Fi network at the “Joe.” Though Joe Louis Arena is only going to host games a little while longer — a new downtown arena is just around the corner — Caflisch said the team in Detroit is already heading down the learning curve of interpreting analytics, with big goals on the horizon.

Right now, some of the most interesting network statistics have to do with fan Wi-Fi usage, including total tonnage, which Caflisch said hit 14 terabytes of data for the Red Wings’ home games this past season. That number is one and a half times bigger per game than the first year the network was in place, he said.

Big spikes for a score

One of the more interesting results came when Caflisch mapped network data to game action, an exercise that showed that hockey games may have bigger data spikes and troughs than other sports.

“We saw that traffic spikes corresponded with scores, and we also had huge spikes during intermissions,” Caflisch said. “And there were huge craters during the periods of regular action.”

While Caflisch said “it was kind of cool” to watch the network action mapped to the game action, in the future he sees the ability for the Red Wings use such actionable moments to better engage fans.

“There’s got to be some kind of marketing potential” to connect with fans during a network-activity spike, Caflisch said. What that is, is still unknown. But using networks to more closely engage fans is a big part of the Red Wings’ road map, especially as Detroit builds out a “venue environment” around the new arena.

According to Caflisch, the team in Detroit is planning to build out a network surrounding the arena, in parking lots and public spaces, including lots of beacons for proximity engagement. Though DAS and Wi-Fi numbers can show where foot traffic goes in and around stadiums, the next level of analytics Caflisch sees as important is on fan spending behavior, on items like parking, concessions and in restaurants and bars near the arena. Future projects in Detroit, he said, might include beacon-generated discounts, like a free coffee at a nearby Tim Horton’s or a free beer at a nearby bar.

“The kinds of things you want to find out are what kind of money are fans spending, and how often do they buy,” Caflisch said. “Do they stick around after the game? Do they rush in at the start? That’s the kind of stuff you’re looking for.”

Of course to get some of that data Caflisch knows the team needs to convince fans to engage digitally, by downloading a team app and providing some information for identification. So far some efforts in that direction have been helpful in identifying fans not in the team’s ticketing database, especially fans coming across the border from Canada.

In Detroit, Caflisch said, the Wings are “now marketing to those people, trying to get them to more games for the same or less money.”

Baylor University: Enlisting fans to help pinpoint problems

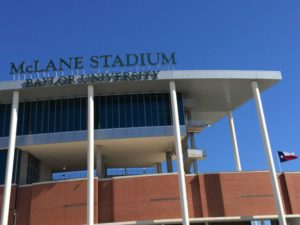
When Baylor University built its new football mecca, McLane Stadium, the stadium technology department was often as nervous as a football team before a big game. Would the new fan-facing Wi-Fi work as planned? Would they be able to solve problems before they became big problems?

Baylor's McLane Stadium. Credit: Paul Kapustka, MSR

Baylor’s McLane Stadium. Credit: Paul Kapustka, MSR

“At the beginning, the questions we asked were along the lines of, ‘can we get through the day,’ ” said Pattie Orr, vice president for information technology and Dean of University Libraries and the public face of the McLane Stadium network. Now that the network team is a couple years into running stadium Wi-Fi, Orr can laugh a bit about the initial fears. But from the beginning, she said, analytics “were a big factor” in making sure the network was running right.

An Extreme Networks deployment, Baylor uses Extreme’s Purview analytics system, which Orr lauds for being “easy to use” and a “great console for real-time information during a game.”

Solving for 2.4 GHz and using fan input

Mostly that means watching the dashboards to see if any APs are causing any errors, something the network stats package can usually show clearly. One of the things the network crew learned quickly during the first season with Wi-Fi was that Baylor fans were using a lot more 2.4 GHz Wi-Fi devices than anyone had thought, meaning that there were more older phones in use that didn’t have the newer 5 GHz Wi-Fi chips.

“The first season we were about 50-50 between 2.4 GHz and 5 GHz, and that surprised us,” said Bob Hartland, director of IT servers and networking services at Baylor. “We had to prioritize for more 2.4 GHz.” This past season, Hartland said, the fan devices skewed closer to 60 percent using 5 GHz bands.

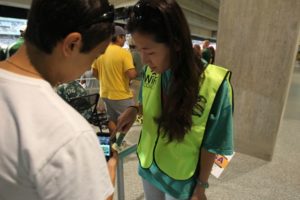
A Baylor "Wi-Fi Coach" helps a fan negotiate the network. Credit: Baylor University

A Baylor “Wi-Fi Coach” helps a fan negotiate the network. Credit: Baylor University

Baylor also added Wi-Fi to its basketball arena this past season, presenting a whole new set of problems, like devices trying to connect to APs across the smaller stadium. Though network analytics were a start, Baylor’s team found out that fan input could also help isolate where problems might be from a physical standpoint. Having a team of “network coaches” on hand also helped pinpoint the problems in a way that might be impossible just working from the network side of things.

This past year, Orr said Baylor added a feature to its stadium app to let fans “send a message to the Wi-Fi coach” with their row number and seat number if they were having a network problem. The coaches (part of most Extreme Wi-Fi deployments) also followed social media like Twitter to see if fans were reporting network problems.

“It’s fantastic to have the live [performance] data from your fans,” Orr said. With fan and network data and area knowledge in hand, the coaches and the network team could more quickly determine if it was a network or device problem, and respond more quickly to the issue. So more data = better solutions, faster.

“If you don’t have good access to analytics you can’t deal with fan [problems] in real time,” Orr said.

VenueNext and the Niners: Finding out who’s in the building

As one of the newer and more technologically advanced venues, Levi’s Stadium often gets noticed for its wireless networks, which set single-day records of 26 terabytes of data for combined DAS and Wi-Fi usage at Super Bowl 50.

A VenueNext beacon enclosure at Levi's Stadium. Credit: VenueNext

A VenueNext beacon enclosure at Levi’s Stadium. Credit: VenueNext

Though wireless performance is important to teams and fans, the information being gathered by the Levi’s Stadium app — built by VenueNext, the company created by the Niners specifically to construct stadium apps — may end up being among the most valuable digital assets, since it helps teams discover exactly who is coming in the building and how they are spending time, attention and dollars.

“We generate data for analytics,” said VenueNext CEO John Paul, talking about the role VenueNext plays as a stadium app partner. One of the more stunning facts revealed after the Niners’ first year at Levi’s Stadium was that via the stadium app, the team was able to increase its marketing database of fan names from 17,000 to 315,000, with even more impressive success in the details.

“We were able to find out things like how many games fans attended, and who they got the tickets from,” said Paul. Such data, he said, helps teams solve the classic problem of “having no idea who’s in the building on any given day.”

Knowing how many hot dogs can be delivered

While VenueNext’s value proposition may be centered on its ability to help teams gather such valuable marketing data, VenueNext itself relies on internal analytics to ensure the services its apps support — like express food ordering and in-seat food delivery — keep working smoothly during games.

After the first season at Levi’s Stadium, Paul said VenueNext learned that it needed to expose some of its data in real-time to fans — “to improve service during the event,” Paul said. One example is that now, if there are too many orders in a certain section, the app can send a message to fans that wait times might be longer than normal. Conversely, if a certain area of the stadium has idle kitchen capacity and runners, a team might send an in-app notification asking if fans want to order something, to create demand.

Over time, Paul said the VenueNext analytics might help teams find out where walk-up concession stands get overloaded by foot traffic, and maybe reconfigure stadium kitchen placements to assist with food delivery options. In the end, he said, it should be seamless to the fans, so that in-seat delivery becomes a regular part of a game-day experience.

“The fans should have no idea where the food comes from,” Paul said.

AT&T: Fans used 2.28 TB of cellular data during Sweet 16 and Elite 8 games

Screen Shot 2016-03-31 at 11.45.34 AMAs the march toward the Final Four continued, fans at the Sweet 16 and Elite 8 venues for the men’s NCAA basketball tournament used a combined 2.28 terabytes of data on the AT&T networks in those venues, according to AT&T. The highest weekend total came from games at the Wells Fargo Center in Philadelphia, where 680 GB were used, according to AT&T.

Combined with the 3.6 TB of data AT&T said was used on its networks at first- and second-round sites, that makes a total of 5.88 TB used so far on AT&T cellular and DAS networks at the various hoops arenas. We’d like to hear from other carriers as well, but none have contacted us so far.

Data totals at this weekend’s Final Four in Houston should be interesting, since the host venue, NRG Stadium, doesn’t yet have a Wi-Fi network. Both AT&T and Verizon have beefed up cellular coverage in and around the arena, but without Wi-Fi it may be hard for fans to top last year’s total of 11 TB used at the Final Four at Lucas Oil Stadium in Indianapolis.

Remember — all Final Four games this weekend are on TBS, not CBS! Of course you can also stream the games if that’s easier.

Betting the Under (Part 2): Putting Wi-Fi antennas under seats is the hot new trend in stadium wireless networks

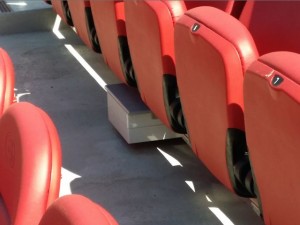
Under-seat Wi-Fi AP at Levi's Stadium. Photo: Paul Kapustka, MSR (click on any photo for a larger image)

Under-seat Wi-Fi AP at Levi’s Stadium. Photo: Paul Kapustka, MSR (click on any photo for a larger image)

Part 2 of this story picks up with the decision to put Wi-Fi APs under seats at Levi’s Stadium. If you missed it, here is the link to Part 1.

According to Chuck Lukaszewski, now vice president of wireless strategy and standards at Hewlett Packard Enterprise (formerly very high density architect in the CTO Office of Aruba Networks), Aruba had been testing under-seat AP designs since around 2010, “in one form or another.” There were some initial tests of under-seat AP deployments at Turner Field in Atlanta and at American Airlines Arena in Dallas, but nothing on the scale of AT&T Park’s 2013 deployment, or on the scale Aruba planned to have at Levi’s Stadium when it opened in 2014.

Some of the first under-seat Wi-Fi deployments in other arenas were actually deployed completely under the stands, Lukaszewski said, with signals shooting up through the concrete. Though he said “you could get reasonably good throughput through concrete,” especially for 2.4 GHz frequencies, installing antennas above the concrete was “considerably better,” Lukaszewski said.

Curiously, one of the biggest problems in stadium Wi-Fi deployment — especially for those heavy on overhead antenna use — is negotiating interference between antennas; sometimes, clients can “see” antennas and APs that are across the stadium, and will try to connect to those instead of the AP closest to them, a problem that leads to inefficient bandwidth use. Interference also means you can’t place APs too closely together, making it somewhat of an art to find ways to increase coverage without increasing interference.

Dan Williams, former VP of technology for the San Francisco 49ers, talking networking at Levi's Stadium. Photo: Paul Kapustka, MSR

Dan Williams, former VP of technology for the San Francisco 49ers, talking networking at Levi’s Stadium. Photo: Paul Kapustka, MSR

What Aruba found in its testing, Lukaszewski said, was that under-seat Wi-Fi AP deployments could be far more dense than overhead-centric designs, mainly because the human bodies in the seats would provide beneficial “blocking” of signals, allowing network designers to place APs more closely together, and to be able to re-use the same Wi-Fi channels in more antennas.

“If you can use human bodies to contain signals, you can have much smaller cells,” Lukaszewski said. Under-seat deployments, he said, “allows us to re-use the same channel less than 100 yards away.”

With more channels available for each AP, the difference in the metric Lukaszewski calls “megabytes per fan” can be “profound” for an under-seat design versus an overhead design, he said.

“We do see trends [in stadium network data] of under-seat being able to deliver well over 100 MB per fan per event, while overhead designs [deliver] significantly under 100 MB per fan per event,” said Lukaszewski.

Dan Williams, the former vice president of technology for the San Francisco 49ers, said he and Lukaszewski were in agreement that under-seat was the best method to deploy at Levi’s Stadium.

Kyle Field at Texas A&M. White spots in stands are under-seat AP locations. Photo: Paul Kapustka, MSR

Kyle Field at Texas A&M. White spots in stands are under-seat AP locations. Photo: Paul Kapustka, MSR

“I just did not believe in overhead,” said Williams, who said he brainstormed with Aruba’s Lukaszewski on the under-seat idea, which they both brought to the Wi-Fi design at Levi’s. By using under-seat APs, Williams said, the Levi’s Stadium design looked to provide “cones [of bandwidth] around the audience, immersing [fans] in a signal.”

After beating the previous year’s Super Bowl Wi-Fi total at its NFL regular-season opener in 2014, Levi’s Stadium’s Wi-Fi network more than passed its biggest test ever this year, carrying a record 10.1 terabytes of Wi-Fi data during Super Bowl 50. Those numbers are proof of Lukaszewski’s claim: “By far, under seat is better.”

New deployments trending to under-seat

Editor’s note: This excerpt is from our latest STADIUM TECH REPORT, our long-form PDF publication that combines in-depth stadium tech reports with news and analysis of the hottest topics in the world of stadium and large public venue tech deployments. Enjoy this PART 1 of our lead feature, or DOWNLOAD THE REPORT and read the whole story right now!

Even though under-seat deployments can be considerably more expensive, especially in a retrofit situation where deployment requires coring through concrete, many stadiums are now seeming to agree with another Lukaszewski claim, that “the return absolutely justifies the investment.”

At AT&T Stadium in Arlington, Texas, the Cowboys quicked followed their sister park’s lead and installed under-seat APs in force ahead of that venue’s hosting of the inaugural College Football Playoff championship game in January of 2015. John Winborn, chief information officer for the Dallas Cowboys Football Club, said the team worked with AT&T’s “Foundry” innovation centers to produce a smaller, sleeker under-seat AP enclosure that fit well with the stadium’s commitment to aesthetics.

Back on the baseball side, the Giants now have 1,628 Wi-Fi APs in their park, with the vast majority of them under-seat, in all three decks of seating. And the Giants’ main rival to the south, the Los Angeles Dodgers, also used under-seat APs in a recent Wi-Fi upgrade.

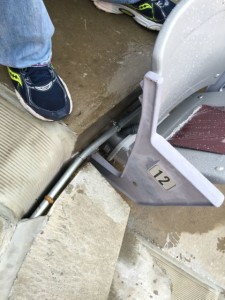
Close-up of conduit running to under-seat AP at Kyle Field. Photo: Paul Kapustka, MSR

Close-up of conduit running to under-seat AP at Kyle Field. Photo: Paul Kapustka, MSR

And if Levi’s Stadium led the way for under-seat Wi-Fi, the new mainly under-seat network at the refurbished Kyle Field at Texas A&M might be the QED on the debate, with ultra-fast network speeds and big data-consumption numbers (including 5.7 TB of Wi-Fi at a game versus Alabama) adding measureable momentum to the under-seat trend. Bill Anderson, CEO of Wi-Fi deployment strategy firm AmpThink, said he was an early disbeliever in under-seat Wi-Fi — until he saw the numbers.

“At first we mocked it, made fun of it,” said Anderson, whose firm has been called in to produce Wi-Fi network designs for several recent Super Bowls, as well as for the Kyle Field design. But when Aruba showed AmpThink the data from under-seat tests and deployments, “that was the ‘a-ha’ moment for us,” Anderson said.

Working with Aruba at Kyle Field, AmpThink was able to collect its own data, which convinced Anderson that under-seat was the way to go if you wanted dense, high-performing networks.

“The really important thing is to get APs closer to the people,” said Anderson. “That’s the future.”

Anderson said some doubters may remain, especially those who try to mix a small amount of under-seat APs with existing overhead deployments, a recipe for lowered success due to the potential interference issues. At Texas A&M, Anderson said AmpThink was able to build a design with far less interference and much greater density than an overhead solution, producing numbers that people have to pay attention to.

“We only know what we’ve observed, but we’re evangelistic supporters” of under-seat designs, Anderson said. “If someone says to you under-seat is hocus-pocus, they’re not looking at the data.”

Not for everyone, but more are trying under-seat

Though proponents of under-seat Wi-Fi all agree on its ability to deliver denser, faster networks, they all also agree that under-seat can be considerably more costly than overhead Wi-Fi, especially in a retrofit situation.

In addition to having to core through concrete seating areas to get conduit to the under-seat APs, the devices themselves need to be sealed, to guard them from weather, drink spills, and the power-washing equipment employed by most stadiums to clean seating areas.

Aruba’s Lukaszewski also noted that under-seat deployments generally use more linear feet of cabling to connect the APs than overhead, which also drives up the cost. Then since under-seat designs tend to use more APs, that also means a higher budget to cover a higher number of devices.

A row shot of the under-seat APs at AT&T Stadium. Photo: Dallas Cowboys

A row shot of the under-seat APs at AT&T Stadium. Photo: Dallas Cowboys

For some stadiums, the construction materials used prohibit the under-seat option from even being tried. At the Green Bay Packers’ legendary Lambeau Field, a late-1950s construction design that used lots of concrete and rebar — as well as part of the stadium’s bottom sitting directly in the ground — meant that under-seat Wi-Fi wasn’t an option, according to Wayne Wichlacz, director of information technology for the Packers.

Other stadiums, like the University of Nebraska’s Memorial Stadium, don’t have enough space between the stadium’s bleacher seats and the floor for under-seat APs to be safely installed. And many schools or teams simply don’t have big IT budgets like the $20-million-plus available to Texas A&M that allowed the Kyle Field design to seek the best result possible.

But many of the new stadiums under construction, as well as existing venues that are planning for new best-of-breed networks, have already committed to under-seat Wi-Fi designs, including the Sacramento Kings’ Golden 1 Center, where Ruckus Wireless will implement its first under-seat stadium Wi-Fi network.

Steve Martin, senior vice president and general manager at Ruckus, said the Golden 1 Center design, planned to be the most dense anywhere, will “primarily be underseat,” a choice he said “helps in a lot of ways.”

Foremost is the performance, something Martin said Ruckus has been testing at the Kings’ current home, the Sleep Train Arena. “It [under seat] does give you the isolation for frequency re-use,” he said.

The under-seat design also makes sense in Golden 1 Center since the stadium’s overall design is very open, with lots of glass walls and unobstructed views.

And under-seat deployment is even making inroads into the distributed antenna system (DAS) world, with Verizon Wireless implementing more than 50 under-seat DAS antennas at Levi’s Stadium prior to Super Bowl 50. Mainly installed to cover the bottom-of-the-bowl rows, the under-seat APs helped Verizon manage a record day for DAS traffic, with 7 TB reported on its in-stadium cellular network during the game.

“To get a quality signal, we had to go under seat,” said Brian Mecum, vice president, network, for Verizon Wireless, who said that in that area of the stadium, under seat was the only way to get a quality signal close to the subscriber’s phone. Verizon, he said, helped design the under-seat DAS antenna, and is looking to deploy it in other stadiums soon.

“It’s the first of more,” he said.

END PART 2… HERE IS THE LINK TO PART 1… TO READ THE WHOLE STORY NOW, DOWNLOAD OUR REPORT!

AT&T: NCAA Men’s hoops sites used 3.6 TB of cellular data

Screen shot 2016-03-21 at 10.45.42 PMWhile your bracket was busy getting busted, AT&T said it saw more than 3.6 terabytes of cellular data cross the networks at the eight stadiums hosting the first rounds of the men’s NCAA basketball tournament last weekend.

In Providence, R.I., at the Dunkin’ Donuts Center, AT&T said it saw 926 GB of cellular data cross its networks there during the first round games, a total perhaps helped by the Yale-Duke game in the second round. Stay tuned for more data updates from NCAA regionals as well as from the Final Four. And any other carriers that want to send their numbers along, please do so!