Stadium Tech Report: Mobilitie adds Wi-Fi to DAS at Columbus Blue Jackets’ Nationwide Arena

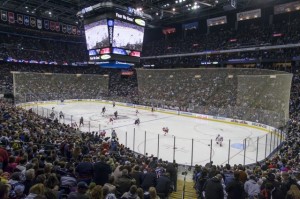
Nationwide Arena. Photos Credit: Columbus Blue Jackets

Nationwide Arena. Photos Credit: Columbus Blue Jackets

Like a team adding a star player to its roster, the Columbus Blue Jackets and Nationwide Arena will kick off their NHL All-Star Game showcase season this week with a new fan-facing Wi-Fi network from Mobilitie, adding to the DAS deployment previously installed by the same company.

The new network, which will use 263 access points from Wi-Fi gear vendor Aruba Networks, is set to go live for the Blue Jackets’ home opener on Oct. 11 against the New York Rangers. According to Jim Connolly, director of IT for the Blue Jackets, having the necessary wireless infrastructure in place is just the first step in a gradual expansion of features designed to enhance the fan experience inside Nationwide Arena. It also corrects a familiar problem with many existing large public facilities, the not-able-to-get-a-signal issue.

“Three or four years ago we noticed a big increase in mobile device use by our fan base,” said Connolly in a recent phone interview. “On the business side of the house we also realized that when the building was full, we had communication issues. You would try to make a [cellular] call, and it would never go through.”

Neutral host the only direction forward

Jim Connolly, director of IT, Columbus Blue Jackets

Jim Connolly, director of IT, Columbus Blue Jackets

Connolly said the decision to go with Mobilitie, with its extensive history of neutral-host DAS deployments, was in part due to the organization’s desire to steer clear of carrier-specific DAS infrastructures. Even though most major carriers will say they are capable of hosting other carriers on a DAS, there are also many known cases of carriers not working well together.

“If you go with a carrier DAS, you have the possibility of isolating part of your fan base,” said Connolly, explaining the team’s desire to use a neutral host for its DAS. What helped seal the deal for Mobilitie was its willingness to also build the Wi-Fi network for no cost to the team. Though DAS helps eliminate most cellular connectivity issues inside large venues, Connolly said the Blue Jackets were “leaning” to having both Wi-Fi and DAS.

“Bringing both Wi-Fi and DAS really elevated their [Mobilitie’s] bid,” Connolly said.

Ready for the All-Star Game

After deploying the DAS in April of 2013, Mobilitie and the Blue Jackets got the Wi-Fi installed over the last offseason, just in time for the year the team will be hosting the NHL All-Star Game and associated celebrations, on Jan. 24-25, 2015.

Hockey at Nationwide Arena

Hockey at Nationwide Arena

“The All-Star Game was definitely a motivator” to get the network finished, Connolly said. “We want to showcase the arena, let fans share via social media and not have any problems with connecting.”

Following the All-Star Game, Nationwide Arena will also host second- and third-round games for the 2015 Men’s NCAA Basketball Tournament, just another of the 200 to 225 events that fill the 18,500-seat arena (it seats more for basketball and concerts) on a yearly basis.

Opened in 2000, the facility was new enough that network installation wasn’t a huge issue, Connolly said.

“It’s a beautiful building — the DAS and Wi-Fi deployments were pretty straightforward, with room for conduits and space available for the head end room,” Connolly said. “It was relatively painless. We were fortunate enough to have adequate space.”

Building in features as you go

Another plus to having a combined provider for both DAS and Wi-Fi is the ability to have a more integrated view of what fans are using the networks for, via analytics.

“We want to be able to see who’s in the building, and who’s doing what,” Connolly said. “Do they want social networking? Do they want food and beverage deals? Do they want to see replays? The analytics will be able to tell us what’s going on.”

While the current Blue Jackets team app is mainly static information — there is a live audio feed and some live stats available — Connolly said that now that the Wi-Fi network is live, more features like live video and in-seat food ordering, or seat upgrades, can be considered.

“We’ll be trying to figure out how to incorporate more in-game aspects, such as giving more access to those who are here in the arena,” said Connolly, also mentioning the possibilities of adding live video, replays, or online concessions. “Over the course of the first year, that’s something we will be figuring out.”
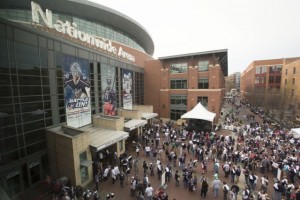
Drop the puck, hockey's back!

Drop the puck, hockey’s back!

AT&T’s DAS and Wi-Fi network traffic for Final Four hits multiple Terabyte levels

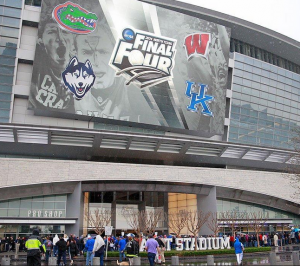
AT&T StadiumWant to host a big sporting event? You better have a big network. Down in Texas, where everything’s big, AT&T had to go as large as possible to keep fans at the recent Final Four connected. According to AT&T, traffic on its cellular and Wi-Fi networks in and around AT&T Stadium surpassed terabyte levels during college basketball’s biggest weekend, with just over a TB of traffic on cellular and more than 4 TB on the stadium’s Wi-Fi network.

Granted, holding the final games of the college basketball season in a football stadium is sort of a guaranteed way to push the envelope when it comes to fan-phone traffic. With 79,444 fans at the semifinal games on April 5, this year’s event set a new record for most people at a college hoops game. Understandably, cell phone traffic also set records as according to AT&T its total data usage on cellular networks inside the stadium for all three games was 885 GB, up from 667 GB used at last year’s tourney in Atlanta and up from 376 GB used 2 years ago in New Orleans. When you throw in data usage at connected areas like the stadium parking lots, AT&T reported 1,268 GB of traffic, which is a massive amount of selfies.

And remember, this is JUST AT&T traffic. No telling how much T-Mobile, Sprint and Verizon customers generated. Anyone at those companies want to let us know, please do so and we’ll add it all up.

In its press releases before the game AT&T made some noise about how it was doing cool things to prepare for the tournament crowd, like putting “stealth” DAS antennas below the court. Any hoops/hockey stadium IT director knows what’s going on there; when you put a basketball court into a facility that has normally wider fields (football or hockey rinks) you have a huge problem bringing connectivity to the VIP courtside seats. Hence, the solution for the Final Four: antennas below the court. Something that will probably be copied in a lot of arenas around the country.

On the Wi-Fi side, AT&T has one of the bigger and better Wi-Fi networks inside its namesake stadium, and it was put to heavy use as well. According to AT&T its stadium Wi-Fi network carried 4,035 GB of traffic total for the three games. Is your network ready for that kind of pressure? How high will this usage surge go? Have we seen the top yet or are connected fans just getting started?

TV Everywhere drives strong growth in March Madness viewership

final4

The push to entice digital viewers to follow this year’s NCAA Basketball tournament was a resounding success for NCAA.com and Turner Sports as their NCAA March Madness Live push underwent continued growth in a year when the championship game was down a bit from the previous year on broadcast television.

The broadcasting of the championship game saw a 10% decline in viewership on television. However the match between Kentucky and Connecticut generated two million live video streams, up 30% when compared with last year’s championship game.

The digital streaming effort, which includes its TV Everywhere initiative, maintained strong support from the digital space even in the face of a number of the better know and more popular schools being eliminated early in the tournament this year.

It set a new record for video consumption, as it has in the past few years, with this year’s event with a 42% increase in live video streaming over last year to bring the collective total over all platforms to 69.7 million live video streams. NCAA March Madness Live registered 15 million hours of live video streaming, a new high and up 7% from 2013.

The mobile space, where tablets and smartphones are still undergoing strong growth themselves, experienced very strong growth with an increase of 71% in live streams over the course of the tournament, and the total hours grew by 38% over last year.

In addition to more viewers, they stayed on longer while viewing watching an average of 67% more minutes than non-registered viewers. While a user can register and watch TV Everywhere on a PC, the use of that platform as a second screen appears to be fading in favor of mobile devices. The live streams on logged-in mobile devices representing 52% of the total TV Everywhere usage for the entire tournament

The growth was in a good part helped by the variety of ways that fans could access the tournament aside from mainstream broadcast television that NCAA.com and its partners Turner Sports and CBS Sports made available. There was an option of any one of three web sites available as well as NCAA March Madness Live available via the Amazon Appstore, Apple App Store, Google Play and Windows Store. On top of all of that fans could watch games via live streaming on TNT, TBS and truTV’s digital platforms, as well as participating TV provider websites.

Mobile viewership soars in setting March Madness record

f4

Mobile digital viewers are making their collective strength known during the current NCAA tournament by blowing away last year’s then record setting totals, and doing so with the championship weekend still ahead.

The numbers of hours of live video consumed is up only slightly from last year but the amount of live video streams that fans are viewing has tremendously increased as users are voting with their tablets, computers and smartphones that streaming video is a viable delivery format for fans.

The breakdown for the tournament through its second week shows that NCAA March Madness Live has seen 13.5 million hours of video watched, a 7% increase over last year’s 12.6 million at this point in the event. That video is comprised of 64 million live video streams over that time period, a 40% increase from last year’s 45 million. To put it in a clearer context last year for the entire tournament there was a total of 49 million videos streamed.

The role of mobile usage in driving up these numbers is obvious. Simply counting the mobile portion of the total streaming viewership shows that smartphones and tablet usage saw a 71% increase over the same two weeks last year with live streaming hours on those two platforms increasing by 38% over the same span a year earlier.

Of course in terms of percentages the growth appears to be leveling off since in 2013 the growth rate for live video streams was 145% over 2012 and the number of hours was up 201% from 2012, but it shows that strong growth is still occurring and is likely to maintain a strong pace going forward.

According to video delivery technology firm Ooyala the amount of minutes video minutes that have been viewed on tablets and smartphones has grown 719% in the last two years and that sports fans spent 62% of the time viewing videos longer than 10 minutes. It estimates that mobile viewership will encompass half of all video viewed by 2016.

Two Final Four Apps Launched
NCAA.com and Turner Sports are launching a pair of event-based apps to take advantage of the interest in the Men’s and Women’s Final Four tournaments this weekend available for Android and Apple mobile devices.

The two apps, NCAA Final Four North Texas app presented by AT&T and Women’s Final Four Nashville will serve fans at the events as well as those that will be following them remotely. For fans in the two towns where the games will be played the app can serve as a guide to the city and event with information such as schedule information, interactive maps, tickets, free Wi-Fi locations in the cities, news, and social media features.

The Men’s app appears to be the more feature rich and has a number of events such as AT&T Final Four Photo Hunt- a scavenger hunt around North Texas, the Coke Zero NCAA Social Arena. Both have an interactive map, the ability to buy tickets and merchandise and a daily events schedule.

Turner Sports to provide viewer options during Final Four broadcasts

turner

The NCAA’s Final Four is one of the most watched sporting events of the year, and for that matter talked about as fans and non fans start early by entering pools of all sorts to predict the winner of the month long tournament..

As the teams get eliminated and it charges down to the finals fans become polarized as to who they want to win based on teams’ reputations, pool results and a host of other issues. Now fans can watch broadcasts that are designed for each team in the Final Four thanks to Turner Sports, the network that will be broadcasting the games.

Sports Business Daily is reporting that the two will take an innovative approach to broadcasting the games at next years’ tournament. There will be the traditional national broadcast that will be seen on TBS. TNT and truTV will then carry the exact same game but with a twist.

Each channel will have a team-centric approach with announcers and camera angles designed to highlight one team. The differentiation does not stop there as the halftime shows will also be different, although pregame and post games shows will be the same.

The Final Four next year will be seen only on cable for the first time and the networks are hoping that they can avoid the tradition viewership drop when a formerly over the air broadcast moves to cable with this move. The championship game will be broadcast on CBS and so will obviously not have dual perspectives.

VCU-Butler Clash Sets Stage for Mobile Sports User Insight

(By Frookie)

Victories by the Virginia Commonwealth (VCU) Rams and Butler Bulldogs to advance to the Final Four of the Men’s NCAA Basketball tournament sets up a best-case scenario for those looking to make money from the evolution of sports viewing on mobile devices.

The two small-market teams with comparatively small fan bases will face off against each other in the Final Four. That means one of the two teams will advance to the Championship in Houston on April 4.

The VCU versus Butler match up is a best-case scenario for those following the advent of sports as a mobile-viewing phenomenon because it means that good data about secondary-market teams will be available sooner rather than later. With VCU and Butler advancing, insight into the appearance of secondary market teams is available for the second consecutive year. Since favorites almost always win, mobile sports programmers could have been waiting years or even decades for year-over-year data of what it means to have a major dark horse in a major sports championship.

Butler’s Bonus From 2010 Final

For those interested in the marketing angle, the VCU-Butler game will give comparative data because it guarantees the second year running that an unheralded team will make it to the Finals. In 2010, Butler versus Duke was a Cinderella story that hoisted the Championship Game to a 16.0/25 rating on television, according to Nielsen Media Research. That tied with 2005’s North Carolina versus Illinois matchup for the highest ratings in 11 years. In 1999, Connecticut and Duke scored 16.9/25.

Last year, mobile viewing of the final doubled up on the television ratings. NCAA March Madness on Demand (MMOD), the online viewing and social media hub for the tournament, reported a total of 575,000 unique visitors who consumed 368,000 hours of Duke vs. Butler on the MMOD video player. That represented a 70 percent increase in viewers and 72 percent increase in hours viewed from 2009, while television ratings increased 35 percent between 2009 and 2010.

Regardless of what the presence of underdogs in the Final Four and NCAA Championship Game ends up showing the major brands about mobile sports programming in general, VCU and Butler already mark big wins for this year’s primary sponsors of MMOD, including Coke Zero and Subway. On-demand video of VCU and Butler will be a hot commodity for hardcore fans who may have focused on Kansas, Ohio State, Duke, Pittsburgh, San Diego State, Arizona and all the other obviously eligible favorites who have already fallen by the wayside.

The minor-market tilt will also give programmers and marketers information that can be used to plan future marketing and advertising strategies. Since neither team is in a major market, it will deliver a more “pure” viewer sample and perhaps help determine whether mobile sports consumers do favor iPads and smart phones for sporting events when a marquee team is not involved.

The other Final Four game, Kentucky versus Connecticut, also on April 2, features teams with major followings, and a superstar NBA prospect in Kemba Walker. Any contrast in usage patterns with VCU and Butler will provide valuable insight for future years.

Both games will help determine what sports programmers do not yet fully know or understand, which is whether the mix of teams in a championship game changes the mode of delivery for major sporting events. If the numbers tell programmers and advertisers that the mix of teams in a Championship game spurs the use of mobile devices as the primary viewing device, as opposed to companion viewing device to big-screen television, that’s information to be used for developing marketing strategies for future Super Bowls, the World Series, NBA Finals and upcoming NCAA Championships. Advertisers who ignore advertising and direct marketing campaigns for mobile devices would risk being blacked out whenever major-market teams are uninvolved in a major sports event, if mobile devices prove a preferred method of access by significant audience segments.