College Football Playoff championship sees 2.4 TB of Wi-Fi — big decline from 2016

We finally have numbers for the Wi-Fi usage at the most recent College Football Playoff championship game, and in somewhat of a first the total data used during the event was much lower than the previous year’s game, with just 2.4 terabytes of data used on Jan. 9 at Raymond James Stadium in Tampa, Fla. — compared to 4.9 TB of Wi-Fi used at the championship game in 2016, held at the University of Phoenix Stadium in Glendale, Ariz.

The reason for the decline is probably not due to any sudden dropoff in user demand, since usage of in-stadium cellular or DAS networks increased from 2016 to 2017, with AT&T’s observed network usage doubling from 1.9 TB to 3.8 TB in Tampa. More likely the dropoff is due to the fact that the Wi-Fi network at the University of Phoenix Stadium had been through recent upgrades to prepare for both the college championship game and Super Bowl XLIX, while the network in Raymond James Stadium hasn’t seen a significant upgrade since 2010, according to stadium officials. At last check, the Wi-Fi network at University of Phoenix Stadium had more than 750 APs installed.

Joey Jones, network engineer/information security for the Tampa Bay Buccaneers, said the Wi-Fi network currently in use at Raymond James Stadium has a total of 325 Cisco Wi-Fi APs, with 130 of those in the bowl seating areas. The design is all overhead placements, Jones said in an email discussion, with no under-seat or handrail enclosure placements. The total unique number of Wi-Fi users for the college playoff game was 11,671, with a peak concurrent connection of 7,353 users, Jones said.

Still tops among college playoff championship games in Wi-Fi is the first one held at AT&T Stadium in 2015, where 4.93 TB of Wi-Fi was used. Next year’s championship game is scheduled to be held at the new Mercedes-Benz Stadium in Atlanta, where one of the latest Wi-Fi networks should be in place and operational.
Mobile Sports Report, Inside Towers partner to expand coverage

INSIDE TOWERS LOGOMobile Sports Report is thrilled to announce a partnership with Inside Towers. Inside Towers delivers breaking, actionable and relevant tower and telecom industry news, straight to your inbox in an easy-to-digest e-newsletter format. It is written for tower people, by tower people and covers a wide variety of topics ranging from regional zoning issues and tower safety to financial impacts, FCC updates and DAS and small cell news.

Reaching over 8,250 wireless infrastructure professionals on a daily basis, Inside Towers is an invaluable industry resource. Sign up for your free trial here and see what all the hype is about.

Super Bowl LI Wi-Fi sees drop in average per-fan use total

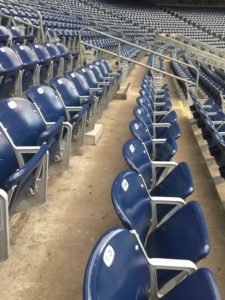
Under seat Wi-Fi APs visible down seating row at NRG Stadium. Credit: 5 Bars

Under seat Wi-Fi APs visible down seating row at NRG Stadium. Credit: 5 Bars

While Super Bowl LI in Houston set records for most total Wi-Fi used in a single day event, the actual amount of average Wi-Fi data used per connected fan actually dropped from the previous year’s game, from about 370 megabytes per user at Super Bowl 50 to about 333 MB per user for Super Bowl 51.

Using official totals provided by the NFL’s official analytics provider, Extreme Networks, there was a total of 11.8 TB of data used on the Wi-Fi network at NRG Stadium in Houston during Super Bowl 51, compared to 10.1 TB used during Super Bowl 50 at Levi’s Stadium in Santa Clara, Calif.

While the total Wi-Fi data number represents approximately a 17 percent increase from Super Bowl 50 to Super Bowl 51, the most recent game had 35,430 users who connected at least once to the network, an almost 30 percent leap from Super Bowl 50’s 27,316 unique users. So while Super Bowl 51 had more unique users (and more peak concurrent users as well) and a higher data total, the average amount of data used per connected fan decreased, from about 370 MB per user to about 333 MB per user.

Data for Super Bowls in years past is thin (mainly because stadium Wi-Fi didn’t really exist), but it’s certainly the first time in very recent history that the per-user average has dropped from one Super Bowl to the next. Super Bowl 49, held at the University of Phoenix Stadium in Glendale, Ariz., saw a total of 6.23 TB of Wi-Fi used, with 25,936 unique users, for a per-user average total of 240 MB. We don’t have any stats for unique users at Super Bowl XLVIII in MetLife Stadium, but with the total Wi-Fi used there at 3.2 TB the average was also presumably much lower as well, unless there were also 50 percent fewer connected users.

Did autoconnect drop the average?

Wi-Fi gear visible above concourse kiosk at NRG Stadium. Credit: 5 Bars

Wi-Fi gear visible above concourse kiosk at NRG Stadium. Credit: 5 Bars

The drop in per-user average data for Wi-Fi is curious when compared to the huge leap in overall DAS stats for the last two Super Bowls, with Super Bowl 51 checking in at 25.8 TB of data, a figure that does not include statistics from T-Mobile, which is declining to report its data total from the game. At Super Bowl 50, all four top wireless carriers combined saw 15.9 TB, so the total for Super Bowl 51 is about 62 percent higher — and if you add in the estimated 3-4 TB that was likely recorded by T-Mobile, that leap is even bigger.

Unfortunately cellular carriers do not provide the exact number of connected users, so there is no per-user average data total available. It would be interesting to know if the expanded DAS preparations made at Super Bowl 50 and at Super Bowl 51 actually connected more total users, or allowed users to use more data per user. We have a request with Verizon for more stats, but it may be a long wait.

One theory we have here at MSR is that it’s possible that a large number of autoconnected devices may have increased the unique-user total while not necessarily adding to the overall Wi-Fi data-used total. In our reporting about the NRG Stadium network we noted that Verizon, which helped pay for the Wi-Fi deployment, had reserved 40 percent of the Wi-Fi capacity for its customers, many of whom could have been autoconnected to the network even without them knowing. We have asked both Extreme and Verizon for a breakdown on Verizon users vs. other wireless customer users on the Wi-Fi network, but have not yet received a response.

Arizona State upgrades DAS, Wi-Fi at Sun Devil Stadium

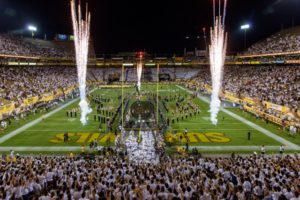
Sun Devil Stadium at Arizona State. Credit all photos: ASU

Sun Devil Stadium at Arizona State. Credit all photos: ASU

When Arizona State University started renovating Sun Devil Stadium three years ago, the project wasn’t so much a simple wireless refresh as it was a total reset of what technology, sports and academia could co-create.

In addition to expanded Wi-Fi and DAS for the stadium (a venue that includes classrooms, meeting rooms and retail outlets), ASU activated a virtual beacon trial. The university also joined up with Intel to explore how Internet of Things devices might yield better environmental information about the bowl, including acoustic data, Jay Steed, assistant vice president of IT operations, told Mobile Sports Report.

The university’s IT department understood that a richer fan experience for football and other events would require a robust network. Steed and his colleagues visited other venues like Levi’s Stadium, AT&T Stadium, Stanford and Texas A&M to get a better handle on different approaches to networking, applications and services.

Regardless, some sort of refresh was overdue. Wedged between two buttes in the southeastern Phoenix suburb of Tempe, the 71,000-seat Sun Devil Stadium was completed in 1958 and needed infrastructure and technology updates. Wi-Fi access was limited to point-of-sale systems and stadium suites; fans generally relied on a DAS network.

Time for an upgrade

Editor’s note: This profile is from our latest STADIUM TECH REPORT, the ONLY in-depth publication created specifically for the stadium technology professional and the stadium technology marketplace. Read about the Sacramento Kings’ new Golden 1 Center and the new Wi-Fi network for the Super Bowl in our report, which is available now for FREE DOWNLOAD from our site!

“The stadium needed a lot of facelifting, not just from a technology perspective but also for the fan experience, like ADA compliance and overall comfort,” Steed said. “We didn’t just want to rebuild a venue for six football games a year, but extend its availability to 365 days and make it a cornerstone and anchor for the whole campus.”

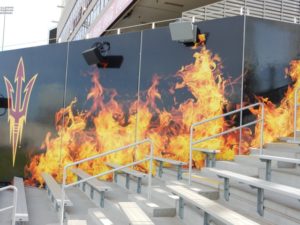
The 'Inferno' student section got a priority for better connectivity.

The ‘Inferno’ student section got a priority for better connectivity.

The reset included tearing out the lower bowl to “punch some new holes” — new entry points to the stadium — and to add conduits and cabling for the new 10-gigabit fiber backbone for the stadium. The network can be upgraded as needed to 40- and even 100-gigabit pipes, according to Steed.

“We wanted to make sure it could support fans’ [connectivity needs] and all the facility’s operations with regard to video and StadiumVision, learning and education, and Pac-12 needs as well,” he said.

The overall stadium renovation was budgeted at $268 million; the technology upgrades will total about $8 million.

The university added 250 new DAS antennas. The vendor-neutral network includes AT&T, Verizon, Sprint and T-Mobile, which share 21 DAS sectors to keep cell service humming inside the stadium.

On the Wi-Fi side, ASU opted for Cisco’s access points. The networking vendor was already entrenched across the 642-acre campus; Steed and the IT department prefer the simplicity of a single-vendor network. Cisco helped with the hardware and RF engineering for Sun Devil Stadium. CenturyLink offered guidance on the networking and fiber pieces of the project, while Hunt-Sundt, a joint venture, was the contractor for most of the physical construction.

Wireless service for ‘The Inferno’

When the renovation is officially completed later in 2017 (most of the network is already live), there will be 1,100 APs in and around Sun Devil Stadium. The student sections, also known as The Inferno, get more APs and bandwidth since historical data has shown students to be the biggest bandwidth consumers in the stadium. Consequently, the ratio in the student sections is one AP to every 50 users; the rest of the bowl’s APs each handle about 75 users on average, Steed said.

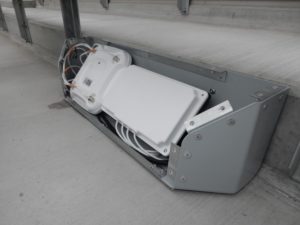
Breakaway look at an under-seat AP

Breakaway look at an under-seat AP

ASU’s new Wi-Fi network was engineered to deliver 1.5 Mbps upstream and 3 Mbps downstream, but Steed said so far users are getting better performance – 8 Mbps up and 12 Mbps down. “We’re getting about 25 percent saturation,” he added. “Many users put their phones away during the games, but we see spikes at halftime and during commercial breaks.” Regardless, ASU continually monitors Wi-Fi and DAS usage and adjusts bandwidth as needed.

Another big challenge is the desert climate – temperatures regularly soar into triple digits. With about 450 under-seat APs in the bowl, Steed and his team had to make sure the enclosures could withstand heat and didn’t obstruct the walkways. “We’ll see how well the electronics do, baking at 120 degrees six months out of the year,” he laughed.

ASU is also working with Intel, using the stadium’s APs as part of an Internet of Things trial. As Steed described it, IoT sensors work alongside stadium APs to measure temperature, noise, vibration and other environmental data. “We also look at lighting control and water distribution and flow,” he said.

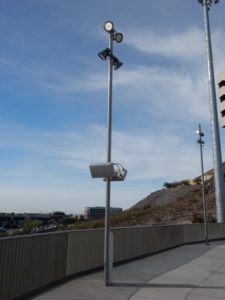
Concourses also got expanded Wi-Fi and DAS coverage.

Concourses also got expanded Wi-Fi and DAS coverage.

Automating the control of environmental functions like heating, cooling, power usage and facilities management will help the university toward its goal of being carbon-neutral by 2025, Steed added. The trials are designed so that the technology can be expanded across the university, possibly for campus transportation kiosks or student concierge services. IoT devices could give students and visitors information about adjacent buildings or landmarks around campus.

Separate but related, the university is also testing cloud-based, Bluetooth low energy (BLE) technology from Mist Systems. These “virtual beacons” use sensors attached to an AP to flag information or a point of interest for students or stadium visitors. “The virtualized beacon technology helps us understand where people are walking around and what they’re looking at in the stadium and elsewhere around campus,” Steed said.

They’re currently being tested in some of Sun Devil Stadium’s suites; Steed foresees expanding that to the student union to help guide people to meeting rooms, retail facilities or food vendors, for example.

Steed credited excellent communication and collaboration among the university’s athletic and IT departments and other players in the upgrade equation. “Our athletic director, Ray Anderson, brought the CIO and me into his office and really worked together with us,” he explained. “The biggest piece of our success was knowing that the AD supported our recommendations and brought us in as valued advisors.”

Update: Super Bowl LI breaks 37 TB wireless mark

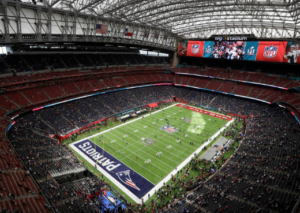
NRG Stadium during Super Bowl LI. Credit: AP / Morry Gash/ Patriots.com

NRG Stadium during Super Bowl LI. Credit: AP / Morry Gash/ Patriots.com

It’s official now, and without any doubt Super Bowl LI broke the single-day wireless data use mark, with at least 37.6 terabytes used.

The official stats for Wi-Fi at NRG Stadium are finally in, with a mark of 11.8 TB, which is a bit more than the 10.1 TB recorded at last year’s Super Bowl at Levi’s Stadium, the previous top mark. The official stats were reported Thursday by Wi-Fi gear provider Extreme Networks, which posted them on the company website.

New DAS records even without any T-Mobile stats

On the cellular side Verizon Wireless, AT&T and Sprint all set new records, with Verizon reporting 11 TB of use and AT&T reporting 9.8 TB, while Sprint (which ran on its own DAS at NRG Stadium) hit 5 TB. At last year’s Super Bowl Verizon (7 TB) and AT&T (5.2 TB) had set their respective previous high-water marks, while Sprint had reported 1.6 TB at Levi’s Stadium. Even without numbers from T-Mobile the current DAS count is 25.8 TB, much higher than the 15.9 TB cellular total from Super Bowl 50.

(Unfortunately, T-Mobile right now is refusing to provide a total data number — a spokesperson who didn’t want to be quoted claimed on a phone call that the total data number was “not relevant,” and that T-Mobile would not provide a final number. However, we did see a blog post from the company claiming it passed its 2.1 TB total from last year by halftime, so at the very least we could probably accurately add at least another 2.2 TB to the overall DAS total. So we may see a combined total of all cellular and Wi-Fi nearing 40 TB before it’s all counted up, approved or not.)

One of our close friends in the business was at the game, and was kind enough to send us a bunch of Wi-Fi speedtests from NRG Stadium (go check our Twitter timeline at @paulkaps to see the tests linked).

What was interesting was watching the speeds go down when “spike” events occurred, like touchdowns and the end of Lady Gaga’s halftime show. The incredible comeback by the New England Patriots to claim a 34-28 overtime victory kept the network busy through the night, and after the game as well during the awards ceremony.

Tom Brady with the Lombardi Trophy. Credit: AP / Patriots.com

Tom Brady with the Lombardi Trophy. Credit: AP / Patriots.com

New record for take rate

According to Extreme, fans at NRG Stadium also set new high-water marks for unique connections to the network as well as for peak concurrent connections. At Super Bowl LI Extreme said it saw 35,430 fans connect to the network, a 49 percent take rate with the attendance of 71,795. Last year at Super Bowl 50 at Levi’s Stadium a total of 27,316 fans connected to the network out of 71,088 attending, a 38 percent take rate.

On the peak concurrent-connection side, Super Bowl LI set a new mark with 27,191 fans connected at one time, according to Extreme. At the Super Bowl 50, the top concurrent-connected mark was 20,300.

Extreme also released some social-media statistics, claiming that 1.7 TB of the Wi-Fi total was social media traffic. Leading the way in order of most users to fewer were Facebook, Instagram, Snapchat and Twitter. Interestingly, Snapchat consumed almost as much data as Facebook, according to pie graphs in the Extreme infographic, which did not provide any actual numbers for those totals. Extreme also did not report what is typically the highest use of bandwidth in any stadium situation, that being Apple iOS updates and Google Gmail activity.

The NFL, which had its own game-day application for Super Bowl LI, has not released any statistics about app use.

Congrats to all the carriers, integrator 5 Bars and Wi-Fi gear supplier Extreme Networks.

THE NEW TOP 6 FOR WI-FI

1. Super Bowl 51, NRG Stadium, Houston, Feb. 5, 2017: Wi-Fi: 11.8 TB
2. Super Bowl 50, Levi’s Stadium, Santa Clara, Calif., Feb. 7, 2016: Wi-Fi: 10.1 TB
3. WrestleMania 32, AT&T Stadium, Arlington, Texas, April 3, 2016: Wi-Fi: 6.77 TB
4. Super Bowl 49, University of Phoenix Stadium, Glendale, Ariz., Feb. 1, 2015: Wi-Fi: 6.23 TB
5. Alabama vs. Texas A&M, Kyle Field, College Station, Texas, Oct. 17, 2015: Wi-Fi: 5.7 TB
6. Pittsburgh Steelers vs. New England Patriots, AFC Championship Game, Gillette Stadium, Foxborough, Mass., Jan. 22, 2017: Wi-Fi: 5.11 TB

THE NEW TOP 4 FOR TOTAL USAGE

1. Super Bowl 51, NRG Stadium, Houston, Feb. 5, 2017: Wi-Fi: 11.8; DAS: 25.8 TB**; Total: 37.6 TB
2. Super Bowl 50, Levi’s Stadium, Santa Clara, Calif., Feb. 7, 2016: Wi-Fi: 10.1 TB; DAS: 15.9 TB; Total: 26 TB
3. Super Bowl XLIX, University of Phoenix Stadium, Glendale, Ariz., Feb. 1, 2015: Wi-Fi: 6.23 TB; DAS: 6.56 TB**; Total: 12.79 TB**
4. WrestleMania 32, AT&T Stadium, Arlington, Texas, April 3, 2016: Wi-Fi: 6.77 TB; DAS: 1.9 TB*; Total: 8.6 TB*

* = AT&T DAS stats only
** = AT&T, Verizon Wireless and Sprint DAS stats only

Verizon goes under concrete to bolster NRG Stadium DAS for Super Bowl LI

Nodes on wheels, or NOWs, provide extra coverage for Verizon Wireless in Houston for Super Bowl LI. Credit: Verizon Wireless

Nodes on wheels, or NOWs, provide extra coverage for Verizon Wireless in Houston for Super Bowl LI. Credit: Verizon Wireless

In a slight twist from its strategy for last year’s Super Bowl, Verizon Wireless has installed DAS antennas underneath the concrete flooring of lower-tier seats at Houston’s NRG Stadium, to provide extra bandwidth for the expected high wireless data usage at Super Bowl LI.

Last year at Levi’s Stadium in Santa Clara, Calif., Verizon beefed up its distributed antenna system (DAS) with under-seat antennas it designed specifically for use in stadiums. The idea of mounting antennas under seats, a growing trend in the stadium Wi-Fi world, is gaining traction as another method of bringing signals closer to fans, especially in places (like lower bowl seats) where there are no overhangs or other places to mount gear.

And while Verizon has been preparing for Sunday’s big game at NRG Stadium for years, that didn’t stop the company from “continually tweaking” its network preparations, according to Leo Perreault, executive director of network operations for Verizon’s South Central market, a region that stretches from west of Florida to Arizona, including Houston. In a phone interview this week, Perreault said that Verizon installed the under-concrete antennas during the middle of the 2016 football season, giving the company “some good experience” with the deployment ahead of Sunday’s game.

Under concrete = easier install and maintenance

A view inside the head end room that runs Verizon's NRG Stadium DAS. Credit: Verizon Wireless

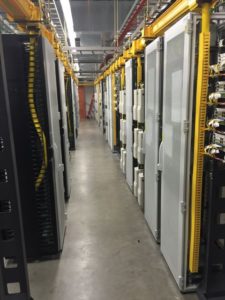
A view inside the head end room that runs Verizon’s NRG Stadium DAS. Credit: Verizon Wireless

It might not be well known outside of wireless networking circles, but signals will travel through concrete; many early stadium Wi-Fi designs (and some current ones, including a new network installed at the Pepsi Center in Denver) use antennas mounted under concrete floors, pointing up. Though fixed under-seat antennas can provide better coverage, Perreault said the ease of deployment made putting the additional DAS antennas underneath the floor a better option in Houston.

“This way [under the concrete] is non-intrusive,” Perrault said, noting that the devices are also not affected by stadium power-washing units. The decision may have been influenced by the fact that NRG Stadium’s new Wi-Fi network had a big issue with moisture in under-seat AP placements, forcing a mid-season rip and replace for all the under-seat Wi-Fi APs.

Even though antennas under concrete are not as powerful, Perrault said Verizon is “very pleased with the performance. It’s a good compromise.”

Biggest stadium DAS?

Between the game being the Super Bowl and it being in Texas, there’s no shortage of hyperbole surrounding the game and all its attendant facets, including the network technology. But when Perreault claims that the DAS Verizon has installed for NRG Stadium “might be the largest we have anywhere,” that might be true since it also serves adjacent properties including the NRG Convention Center, the NRG Arena and an outdoor DAS in the surrounding spaces. In addition to Houston Texans games, NRG Park (which includes the stadium) is also host to the Houston Livestock Show and Rodeo, which humbly bills itself as the “world’s largest livestock show and richest regular-season rodeo.”

An alien spaceship, or a temporary cell tower from Verizon? You choose.

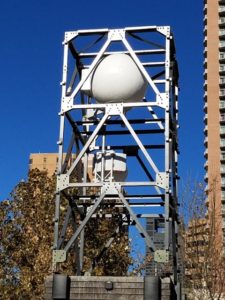
An alien spaceship, or a temporary cell tower from Verizon? You choose.

Inside NRG Stadium, Perreault said the new Verizon DAS (built before the 2015 season) has more than 900 antennas. As neutral host, Verizon will also provide access to AT&T and T-Mobile on its network; Sprint, which built a previous DAS at NRG, will continue to run on that system.

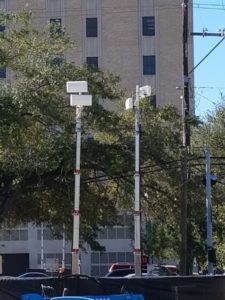
Outside the stadium and around Houston, Verizon has done the usual big-event preparations, with lots of permanent and temporary macro network improvements, and portable units like COWs (cells on wheels) and smaller NOWs (nodes on wheels). You can review all the Verizon preparations in a company blog post.

As previously reported in MSR, Verizon also helped foot part of the bill for the new NRG Stadium Wi-Fi network, a deal that will give Verizon a reserved claim to 40 percent of the Wi-Fi network’s capacity, according to Perreault.

Whether or not Super Bowl LI breaks the wireless data consumption records set at last year’s game remains to be seen, but Perreault said there doesn’t seem to be any slowing down yet of the perpetual growth in wireless data use at stadiums, especially at big events like the Super Bowl.

“Fans just seem to find ways to consume whatever additional bandwidth you provide,” he said.