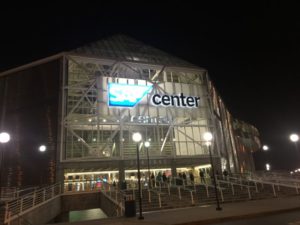
Despite the fact that loyal hockey fans always faithfully filled the seats to support their San Jose Sharks, the building now known as the SAP Center somehow never had the kind of wireless network you’d think its tech-savvy locals would demand.
But that was then. This is now.
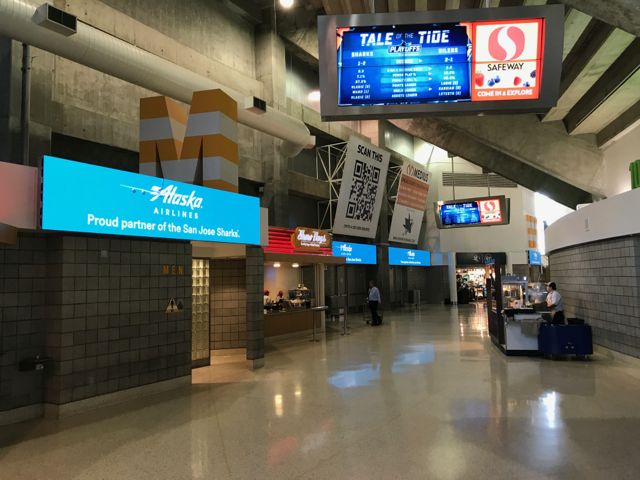
After years of low connectivity, the “Shark Tank” is now filled with speedy, high-definition Wi-Fi that forms the base of a new digital-experience strategy for the Sharks and the SAP Center. The new digital experience includes a new team app as well as multiple LED screens in all parts of the stadium, bringing the old building screaming into the forefront of older venues retrofitted with technology that both enhances the fan experience while providing new business opportunities.
“If sports is behind the world in technology, we were even behind in sports,” said John Tortora, chief operating officer for the San Jose Sharks, about the building’s historical shortcomings. Interviewed between periods during a late-January visit by Mobile Sports Report to a Sharks game at SAP Center, Tortora said a sort of perfect storm of desires and needs arrived this past postseason, ending up as an initiative that brought in the arena’s first true fan-facing Wi-Fi network, an expanded LED-screen deployment throughout the arena and a new stadium app. Together, the elements are all aimed at supporting a data-driven strategy to improve marketing efforts while simultaneously providing a huge boost to the fan experience.
And make no mistake about it, better connectivity was an amenity fans wanted most of all.
High-density Wi-Fi provides digital backbone
Editor’s note: this profile is from our most recent STADIUM TECH REPORT, which also has in-depth looks at new networks at the Utah Jazz’s Vivint Smart Home Arena, and a recap of wireless activity from Super Bowl LI! DOWNLOAD your FREE COPY today!“We had a survey of fans from the first half of last season, and the direct response was that the Wi-Fi needed to be improved,” Tortora said. Though there was some Wi-Fi in the building — according to Tortora, there was a system deployed in 2013 — it wasn’t anything the team wanted to talk about or promote; in fact, multiple requests by MSR to review the stadium’s networking infrastructure went ignored for years, prior to the new initiative now in place.
According to Tortora, there were also previously a number of different standalone apps for the various activities that took place in the building, including separate ones for the Sharks, the seasonal Disney ice shows, for youth hockey programs and for other SAP Center events like concerts. Bringing multiple apps together into a unified strategy led the Sharks to simultaneously seek a partner to help upgrade the mobile network infrastructure. Tortora said the Sharks found that partner in Cisco, which brought Wi-Fi gear and its StadiumVision digital-display system as well as some creative financing to the table.
“We had a chance to parallel both a new app and a new infrastructure, and Cisco was a great partner,” Tortora said. Though the terms are undisclosed, Cisco is also participating in the financing and operation of the network marketing elements as a partner to the Sharks.
The Sharks also brought in Wi-Fi deployment expert firm AmpThink to lead the network design, and used Daktronics technology for the multiple new LED boards, many of which are located in the previously blank-walled concourse and club areas. The result is a high-density Wi-Fi network operating at peak speeds, which forms the base for a high-touch digital experience that will ultimately give the Sharks deeper insight into fan behaviors, and a more personal way to deliver the right experience to each fan walking through the doors.Going low and high to deliver Wi-Fi
Even before you get inside the building, you can connect to the new SAP Center Wi-Fi network, thanks to a bank of APs mounted on the outside walls. Allison Aiello, director of information technologies for the Sharks, said that many fans typically gather just outside the arena pregame, especially in a park just to the east side, and with the push toward more digital ticketing, providing pre-entry connectivity was a must.
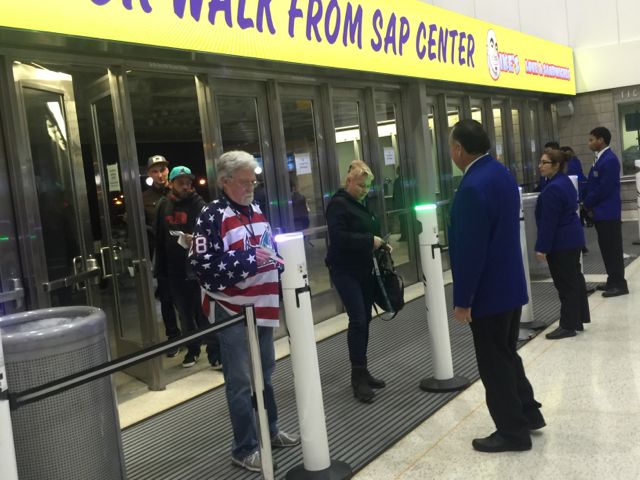
Once inside the doors, fans are greeted by the innovative “Kezar” scanners from app developer VenueNext, which can scan either paper or digital tickets, with a green light on the top of the cylindrical system showing that a ticket is valid. Connectivity inside the entryways is also superb, as our tests showed Wi-Fi download speeds in the mid-60 Mbps range, even as crowds of fans came in through the doors.
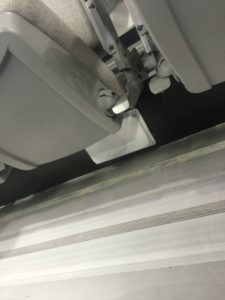
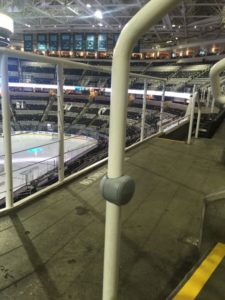
A quick lower-level visit to the main data room showed some of the challenges of retrofitting an older building (the arena, which opened in 1993, had been known as the Compaq Center and the HP Pavilion before becoming the SAP Center in 2013): One of the members of our tech-tour entourage bumped his head on a low-hanging pipe, part of the ice-making infrastructure, on the way to the data center doorway.With more than 20 years of cabling history inside its walls, the SAP Center wiring closets were an ongoing challenge for the implementation crew from AmpThink, which took pride in its work to streamline and organize the wiring as it installed the new network (with some of the cabling in new, Shark-specific teal coloring). Moving out into the lower seating bowl, AmpThink president Bill Anderson showed off some of the under-seat and railing-mounted AP enclosures, where attention to detail includes drilling concrete cores around the railings below the surface level so that shoes, brooms and other items don’t catch on areas where work has been done.
Anderson said the lower-bowl network is only operating on 5 GHz Wi-Fi channels, adding San Jose to an industry trend of leaving 2.4 GHz channels off the network in fan-facing areas. The main reason for this switch has to do with both the administrative challenges of the 2.4 GHz networks, along with the fact that almost all consumer devices these days support the wider bands of the 5 GHz space. Anderson also had high praise for Cisco’s new 3800 series of Wi-Fi APs that were used in the deployment, which can support dual 5 GHz channels.
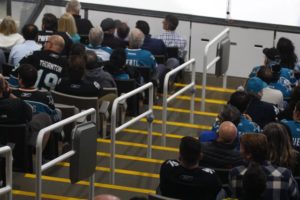
According to the Sharks’ Aiello, there are 49 handrail Wi-Fi enclosures in the lower seating bowl, with 47 of those having two APs in each enclosure. For concerts, she said the arena can hang additional APs over the sideline hockey boards, which stay in place while the end zone boards are removed. The total number of APs in the stadium is 462. Our pregame network tests prior to a Sharks-Blackhawks game on Jan. 31 showed a Wi-Fi speed of 63.39 Mbps download and 57.59 upload, halfway down the stairs between sections 114 and 115.
Overhead Wi-Fi for the upper deck
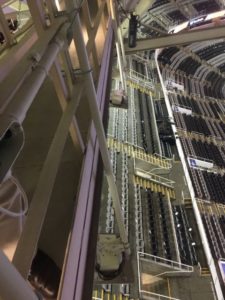
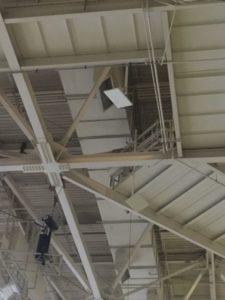
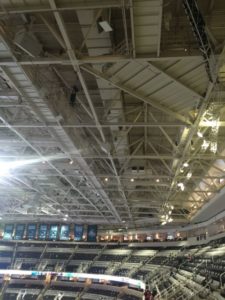
In stadiums where under-seat or handrail APs are used, it’s usually best to not combine those placements with overhead APs since client devices will often seek to connect first to overhead APs, even if they are farther away. But due to a quirk in the SAP Center’s construction, AmpThink went with a deployment strategy of overhead APs for the arena’s upper seating deck, mainly because of the low ceiling that is closer to the seats than many other indoor venues.
Though combining different AP architectures is tricky, AmpThink’s Anderson said it’s better to pick “the one that’s economically right” rather than staying stuck with one method. Overhead placements like SAP Center’s, which are hung from the walkways near the roof, are typically much cheaper per placement than under-seat or handrail deployments, which often require extensive work including core drilling through concrete floors.“I was a little concerned at first [about the combination of overhead and railing placements] but the roof is close enough to work,” said Aiello of the dual placement methods. According to AmpThink’s Anderson, most of the overhead antennas are about 30 feet away from the seats, with the farthest being 45 feet away — still close enough so that the power needed to reach fans doesn’t bleed the signal down into the lower bowl. Aiello also noted that an under-seat or handrail AP design for the upper deck would have required the Sharks the extra expense and work to drill through the ceilings of the stadium’s premium suites, which are located between the two main bowl seating levels.
In the upper deck section 219, we tested the Wi-Fi at several seating locations and came up with consistently fast speeds, including one at 48.88 Mbps/44.96; at the lounge area along the arena’s top row we saw even faster speeds, including a mark of 68.00/68.52. We also saw many VenueNext railing-mounted beacon enclosures, part of a planned 500-beacon network that Aiello said will be coming online sometime soon.
Since hockey games have two long breaks built into each game, it’s extremely important for venues to provide good connectivity in concourse and club areas where fans typically congregate between periods. And even though the SAP Center is an older building — which sometimes makes aesthetics a challenge — AmpThink and the Sharks were able to hide almost all of the APs that are placed every 50 feet around the main circular concourse thanks to a small drywall facade that sticks out from the main wall to support directional and section-number signage.
While some of the Wi-Fi speedtests we took while roaming the concourse during the crowded pre-game were in the high 40 Mbps range, we also got a few tests much higher, with one at 67.94 Mbps/ 58.14 Mbps, and another at 63.76 / 55.96, the latter near a crowded concession area. And even with fans streaming in at a good clip, we even got one test at 69.62 / 70.54 near a doorway, showing that walk-around coverage appears to be solid throughout the building.
And even though the Sharks were eliminated in the first round of this year’s playoffs, fans used the SAP Center Wi-Fi at higher levels than normal during the postseason. According to Aiello, the stadium saw a peak of 5,013 concurrent users en route to a total of 1.3 terabytes of data used at the first home playoff game; the second home game saw 1.1 TB of data used, with 4,890 peak concurrent users.New LED boards keep fans connected while out of seats
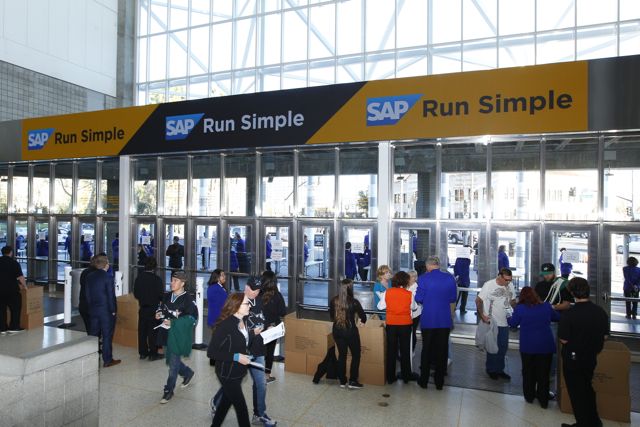
If the Wi-Fi APs will remain hidden to fans strolling the concourses, the new LED boards will have an opposite effect — instead of just a few TV screens here and there, the Sharks and Daktronics, along with AmpThink and Cisco have gone all-in with a strategy that has multiple-screen boards and long banks of LED strips that can all be controlled and programmed from a single location, thanks to the Cisco StadiumVision system.
Having networked and controllable screens is a huge plus for administration — according to Aiello the previous setup required manual walk-arounds to configure and check each display. AmpThink also helped reduce the wiring needed for all the new displays by connecting the LED boards to the IP cabling used for the Wi-Fi system.
“The video, audio and Wi-Fi all used to be discrete systems,” said AmpThink’s Anderson. “Now they all roll up to one converged network.”With StadiumVision, the Sharks will be able to program the displays on the fly, substituting advertising for live game action as quickly as hockey teams change players on the ice. Aiello noted that the combination of screens and a beacon system will allow the Sharks to sell more targeted advertising with real metrics showing the number of fans in the area of a display. Big displays mounted above doorways can also be changed to assist with foot traffic and transportation info for postgame exit flows.
App already providing more marketing leads
Wrapping it all together in the fans’ hands is the new app from VenueNext, a company Tortora said the Sharks had been in contact with since its inaugural launch of the Levi’s Stadium app for the San Francisco 49ers. While the VenueNext app will evolve over time to potentially add in a list of services, the ability to let fans move tickets around digitally has already helped the Sharks start down their desired path of having more personalized information to better reach current and prospective customers.
“During the preseason this year we had 2,500 tickets transferred per game, versus 800 during last year’s preseason games,” Tortora said. Because many of those transfers involved sending tickets to email addresses or phone numbers that weren’t current season ticketholders, Tortora said the Sharks were able to add approximately 7,500 new names to their ticket marketing database, which Tortora simply called “gold.”
“To do digital tickets, fans have to download the app, so now we can market directly to that person,” Tortora said. That move will help the Sharks identify things like “who’s not coming to games and why,” which may help the team find out early if fans may not be wanting to renew season tickets, and market to them accordingly.A Cisco-built fan portal is also part of the overall package, and eventually the team hopes to use that software to construct more-personal marketing messages that can be determined by factors including live presence and location within the building. As more data accumulates, Tortora said the Sharks plan to get even deeper into a strategy currently underway that revolves around dynamic ticket pricing.
“We can use data to find out where seats are in demand, and where some sections may not be selling well,” Tortora said, and shift prices accordingly. The team has already broken seating prices into 16 different categories for this season, with plans to expand that to 36 different categories for next season, Tortora said.
“Airlines do this, hotels do this,” Tortora said. “It’s all about being data-driven.”
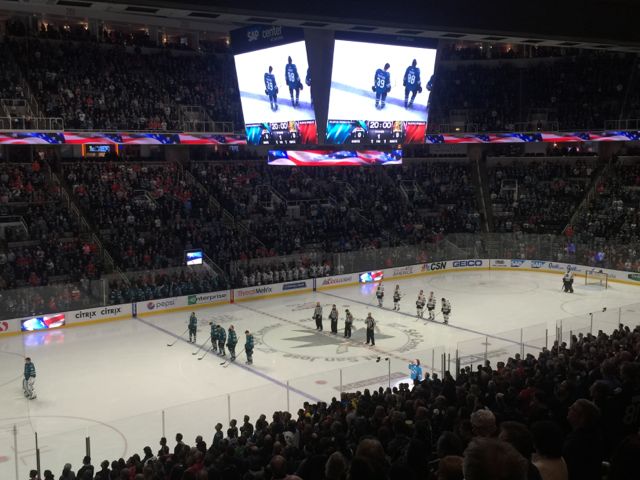
The Sharks and Blackhawks get ready to rumble. Credit: Paul Kapustka, MSR
LED screens above an entryway. Credit: Paul Kapustka, MSR
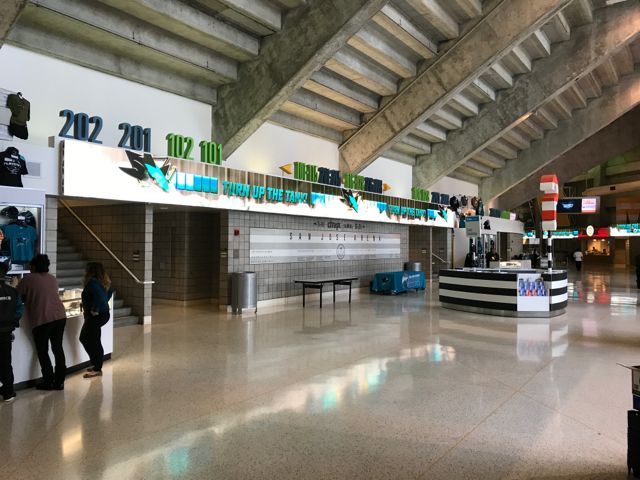
More LED screens above the seating entry areas in the main concourse. Credit: San Jose Sharks
LED screens above entryway, where fans use the VenueNext ‘Kezar’ scanners to validate tickets. Credit: Paul Kapustka, MSR
Even more LED screens, on a different concourse. Credit: San Jose Sharks
