Commentary: Venues need to think of connectivity beyond the stadium walls

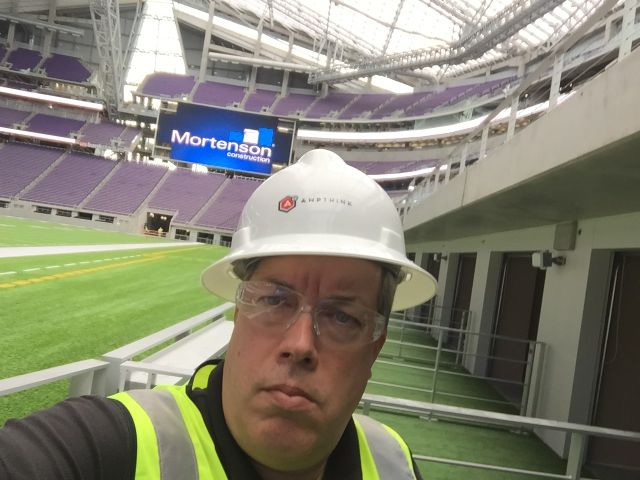
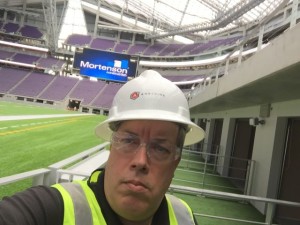
MSR editor Paul Kapustka via selfie from the field-level suites at US Bank Stadium.

MSR editor Paul Kapustka via selfie from the field-level suites at US Bank Stadium.

Last month, if you wanted a seat inside US Bank Stadium in Minneapolis you needed a getup like the one I’m wearing in the picture – including what you can’t see, the steel-toed shoes and the gloves that kept me from scratching any of the already-finished surfaces. Almost ready to open its doors, I can tell you that US Bank Stadium is a beauty, and that we’ll have a full report soon. For now enjoy the “sneak peek” photo essay we posted earlier.

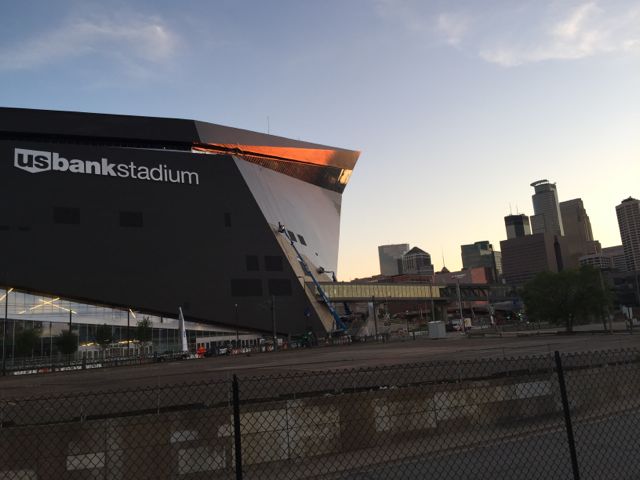
Outside the architecturally angled walls of the stadium, what really impressed me during a recent quick visit to Minneapolis was how well the stadium operators are working with entities like the city, state and other large public gathering places, to ensure that the large streams of humanity traveling to and from the 67,000-seat facility have the best experience possible, both before and after events.

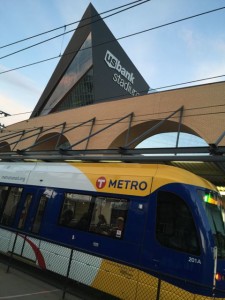
Like most travelers, my experience with Minneapolis’ integrated infrastructures started at the airport, where I took the simple and easy to understand light rail directly into downtown. I noticed that the train already stops directly at one of the US Bank Stadium doors, unlike some other stadiums where mass transit connections are a sometimes-lengthy walk away. That the stadium already has its own stop even before it opens shows that at the very least, people were thinking and talking even before the concrete was poured.

Light rail stop at the front door of US Bank Stadium. Credit: Paul Kapustka, MSR

Light rail stop at the front door of US Bank Stadium. Credit: Paul Kapustka, MSR

Mass transit a priority for US Bank Stadium

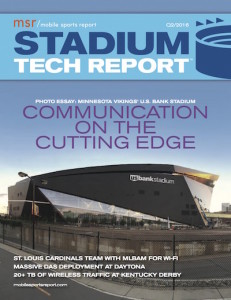
Editor’s note: This editorial is from our most recent STADIUM TECH REPORT, the Q2 issue which contains a feature story on Wi-Fi analytics, and a sneak peek of the Minnesota Vikings’ new US Bank Stadium. DOWNLOAD YOUR FREE COPY today!
With no large parking lots right next to the stadium and only some scattered lots (as far as I could tell) downtown, the light rail is clearly going to be an integral part of getting fans to and from the venue, both for regular-season Minnesota Vikings games as well as for Super Bowl 52 a couple Februarys from now. To make that trip easier, the light rail also extends past the airport to the Mall of America, a key link in the integrated civic infrastructure.

Why is the mall a part of this? Mainly because it is also a transit center (it has a large space where buses, trains and car parking are all together) and because it offers free parking – meaning that fans can simply park at the mall and spend a couple bucks taking the half-hour train to US Bank Stadium (or also to Target Field, which is just a few stops farther through downtown). Courtesy of a recent deployment there is now high-quality Wi-Fi in the mall itself, and at many places in Minnesota proper there is free civic Wi-Fi. There are also plans afoot to bring Wi-Fi to the light rail trains themselves. While it might not seem like much, the idea of being able to be highly connected all the way from parking at the mall to your seat in the stadium is a fan’s dream come true, enabling all the connectivity wants or needs that can happen during a game or event day.

Having witnessed some other stadiums opening without much coordination, it’s impressive and great to hear that the Vikings and Minneapolis are already planning for things like overcrowded trains after games (since more people leave at the same time than arrive at the same time), with plans to close off one of the stadium’s bordering streets and to have dozens of buses on hand to handle the overflow. There’s also plans to have stadium TVs show mass transit schedules as fans depart, and also options to remain downtown for post-game eating or celebrations.

VTA line following Levi's Stadium hockey game in 2015.

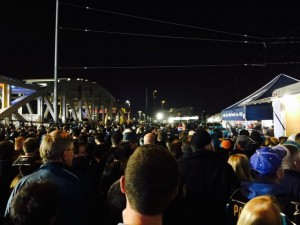
VTA line following Levi’s Stadium hockey game in 2015.

How else are the Vikings, the city and the state planning to work together? In our interviews we heard about plans to use real-time traffic mapping to close off crowded exits and to direct fans to faster paths to and from the stadium, and to perhaps be able to communicate such directions to fans via the team’s new mobile app. While it all still needs to be done in real time on a real game day, just the thinking about the fact that a “game day” doesn’t start or stop at the stadium premises is a refreshing one, especially for a venue that will host a Super Bowl in just over a year and a half.

While we’ve heard of other, similar plans to extend connectivity beyond the stadium walls – here we are thinking of the downtown plan around Nationwide Arena in Columbus, Ohio, and new plans for “fan plazas” outside such venues as Wrigley Field and Lambeau Field – the Vikings seem to have looked even farther out, to try to ensure that the connected fan experience goes as far as it possibly can. Again, the proof will be in the execution, but like the view from outside US Bank Stadium, the ideas hatching in Minnesota look pretty good.
Wi-Fi Analytics: Taking the first steps

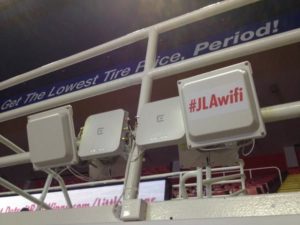
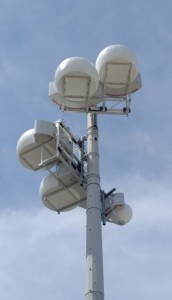
Wi-Fi antennas at Joe Louis Arena. Credit: Detroit Red Wings (click on any photo for a larger image)

Wi-Fi antennas at Joe Louis Arena. Credit: Detroit Red Wings (click on any photo for a larger image)

Even though the physical construction and deployment of a fan-facing Wi-Fi network seems like the biggest challenge facing a stadium’s information technology team, in reality everyone involved knows it’s just step one.

While turning on a live network is certainly a great accomplishment, once the data starts flowing the inevitable questions follow: Now that we have Wi-Fi, what do we do with it? And how do we find out who’s using it, why they are using it, and how can we use that information it to find out better ways to improve the fan experience while also improving our business?

Those “step two” questions can only be answered by analytics, the gathering of information about Wi-Fi network performance and user activity. And while almost every live network operator almost instantly uses performance numbers to help tune the system, plans to harvest and digest the more personalized information like end-user identification, application use and fan engagement are just getting started, even at the most technically advanced stadiums with Wi-Fi networks in place.

What follows here are some conversations with stadium tech professionals who are already running fan-facing Wi-Fi networks, exploring how they use Wi-Fi metrics and analytics to both enhance the game-day experience for fans while also building a base of information that can be used by both technical staffs and marketing organizations inside the team, school and venue organizations.

Even this small sample seems to suggest that while Wi-Fi networks may be somewhat pervasive in the larger stadiums across the country, the harvesting and processing of data generated by digital fan engagement is just getting started, with plenty of unanswered questions and experiments that have yet to bear significant fruit. Yet everyone we spoke with also had an unshakable confidence that getting metrics and analytics right was the key to wireless success over the long haul, and all are fully engaged in pursuing that goal. It may take longer than physical deployment, but the “step two” of learning from the networks is well underway.

Detroit Red Wings: Pushing past the initial learning curve

Editor’s note: This profile is from our most recent STADIUM TECH REPORT, the Q2 issue which contains a feature story on Wi-Fi analytics, and a sneak peek of the Minnesota Vikings’ new US Bank Stadium. DOWNLOAD YOUR FREE COPY today!

Now that the Wi-Fi network at Joe Louis Arena in Detroit is coming up on its second birthday, Tod Caflisch said network administrators can relax a bit on game nights. Early on, however, he remembers “babysitting” the network during games, watching live performance stats to make sure everything was working correctly.

Watching the live network performance statistics, Caflisch said, “I could tell if there were issues. If throughput looked a little flat, we might have to reboot a switch. It was important, because there was so much at stake.”

As former director of information technology for the NHL’s Detroit Red Wings (he recently left Detroit and is now with the Minnesota Vikings), Caflisch helped drive the deployment of an Extreme Networks Wi-Fi network at the “Joe.” Though Joe Louis Arena is only going to host games a little while longer — a new downtown arena is just around the corner — Caflisch said the team in Detroit is already heading down the learning curve of interpreting analytics, with big goals on the horizon.

Right now, some of the most interesting network statistics have to do with fan Wi-Fi usage, including total tonnage, which Caflisch said hit 14 terabytes of data for the Red Wings’ home games this past season. That number is one and a half times bigger per game than the first year the network was in place, he said.

Big spikes for a score

One of the more interesting results came when Caflisch mapped network data to game action, an exercise that showed that hockey games may have bigger data spikes and troughs than other sports.

“We saw that traffic spikes corresponded with scores, and we also had huge spikes during intermissions,” Caflisch said. “And there were huge craters during the periods of regular action.”

While Caflisch said “it was kind of cool” to watch the network action mapped to the game action, in the future he sees the ability for the Red Wings use such actionable moments to better engage fans.

“There’s got to be some kind of marketing potential” to connect with fans during a network-activity spike, Caflisch said. What that is, is still unknown. But using networks to more closely engage fans is a big part of the Red Wings’ road map, especially as Detroit builds out a “venue environment” around the new arena.

According to Caflisch, the team in Detroit is planning to build out a network surrounding the arena, in parking lots and public spaces, including lots of beacons for proximity engagement. Though DAS and Wi-Fi numbers can show where foot traffic goes in and around stadiums, the next level of analytics Caflisch sees as important is on fan spending behavior, on items like parking, concessions and in restaurants and bars near the arena. Future projects in Detroit, he said, might include beacon-generated discounts, like a free coffee at a nearby Tim Horton’s or a free beer at a nearby bar.

“The kinds of things you want to find out are what kind of money are fans spending, and how often do they buy,” Caflisch said. “Do they stick around after the game? Do they rush in at the start? That’s the kind of stuff you’re looking for.”

Of course to get some of that data Caflisch knows the team needs to convince fans to engage digitally, by downloading a team app and providing some information for identification. So far some efforts in that direction have been helpful in identifying fans not in the team’s ticketing database, especially fans coming across the border from Canada.

In Detroit, Caflisch said, the Wings are “now marketing to those people, trying to get them to more games for the same or less money.”

Baylor University: Enlisting fans to help pinpoint problems

When Baylor University built its new football mecca, McLane Stadium, the stadium technology department was often as nervous as a football team before a big game. Would the new fan-facing Wi-Fi work as planned? Would they be able to solve problems before they became big problems?

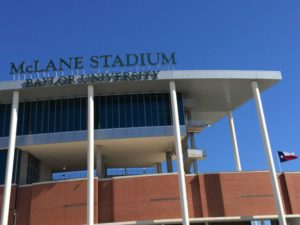
Baylor's McLane Stadium. Credit: Paul Kapustka, MSR

Baylor’s McLane Stadium. Credit: Paul Kapustka, MSR

“At the beginning, the questions we asked were along the lines of, ‘can we get through the day,’ ” said Pattie Orr, vice president for information technology and Dean of University Libraries and the public face of the McLane Stadium network. Now that the network team is a couple years into running stadium Wi-Fi, Orr can laugh a bit about the initial fears. But from the beginning, she said, analytics “were a big factor” in making sure the network was running right.

An Extreme Networks deployment, Baylor uses Extreme’s Purview analytics system, which Orr lauds for being “easy to use” and a “great console for real-time information during a game.”

Solving for 2.4 GHz and using fan input

Mostly that means watching the dashboards to see if any APs are causing any errors, something the network stats package can usually show clearly. One of the things the network crew learned quickly during the first season with Wi-Fi was that Baylor fans were using a lot more 2.4 GHz Wi-Fi devices than anyone had thought, meaning that there were more older phones in use that didn’t have the newer 5 GHz Wi-Fi chips.

“The first season we were about 50-50 between 2.4 GHz and 5 GHz, and that surprised us,” said Bob Hartland, director of IT servers and networking services at Baylor. “We had to prioritize for more 2.4 GHz.” This past season, Hartland said, the fan devices skewed closer to 60 percent using 5 GHz bands.

A Baylor "Wi-Fi Coach" helps a fan negotiate the network. Credit: Baylor University

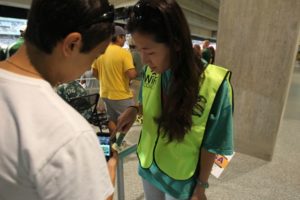
A Baylor “Wi-Fi Coach” helps a fan negotiate the network. Credit: Baylor University

Baylor also added Wi-Fi to its basketball arena this past season, presenting a whole new set of problems, like devices trying to connect to APs across the smaller stadium. Though network analytics were a start, Baylor’s team found out that fan input could also help isolate where problems might be from a physical standpoint. Having a team of “network coaches” on hand also helped pinpoint the problems in a way that might be impossible just working from the network side of things.

This past year, Orr said Baylor added a feature to its stadium app to let fans “send a message to the Wi-Fi coach” with their row number and seat number if they were having a network problem. The coaches (part of most Extreme Wi-Fi deployments) also followed social media like Twitter to see if fans were reporting network problems.

“It’s fantastic to have the live [performance] data from your fans,” Orr said. With fan and network data and area knowledge in hand, the coaches and the network team could more quickly determine if it was a network or device problem, and respond more quickly to the issue. So more data = better solutions, faster.

“If you don’t have good access to analytics you can’t deal with fan [problems] in real time,” Orr said.

VenueNext and the Niners: Finding out who’s in the building

As one of the newer and more technologically advanced venues, Levi’s Stadium often gets noticed for its wireless networks, which set single-day records of 26 terabytes of data for combined DAS and Wi-Fi usage at Super Bowl 50.

A VenueNext beacon enclosure at Levi's Stadium. Credit: VenueNext

A VenueNext beacon enclosure at Levi’s Stadium. Credit: VenueNext

Though wireless performance is important to teams and fans, the information being gathered by the Levi’s Stadium app — built by VenueNext, the company created by the Niners specifically to construct stadium apps — may end up being among the most valuable digital assets, since it helps teams discover exactly who is coming in the building and how they are spending time, attention and dollars.

“We generate data for analytics,” said VenueNext CEO John Paul, talking about the role VenueNext plays as a stadium app partner. One of the more stunning facts revealed after the Niners’ first year at Levi’s Stadium was that via the stadium app, the team was able to increase its marketing database of fan names from 17,000 to 315,000, with even more impressive success in the details.

“We were able to find out things like how many games fans attended, and who they got the tickets from,” said Paul. Such data, he said, helps teams solve the classic problem of “having no idea who’s in the building on any given day.”

Knowing how many hot dogs can be delivered

While VenueNext’s value proposition may be centered on its ability to help teams gather such valuable marketing data, VenueNext itself relies on internal analytics to ensure the services its apps support — like express food ordering and in-seat food delivery — keep working smoothly during games.

After the first season at Levi’s Stadium, Paul said VenueNext learned that it needed to expose some of its data in real-time to fans — “to improve service during the event,” Paul said. One example is that now, if there are too many orders in a certain section, the app can send a message to fans that wait times might be longer than normal. Conversely, if a certain area of the stadium has idle kitchen capacity and runners, a team might send an in-app notification asking if fans want to order something, to create demand.

Over time, Paul said the VenueNext analytics might help teams find out where walk-up concession stands get overloaded by foot traffic, and maybe reconfigure stadium kitchen placements to assist with food delivery options. In the end, he said, it should be seamless to the fans, so that in-seat delivery becomes a regular part of a game-day experience.

“The fans should have no idea where the food comes from,” Paul said.

First look at Minnesota Vikings’ new US Bank Stadium

As part of our new STADIUM TECH REPORT for Q2 2016, Mobile Sports Report was allowed inside the still-under-construction US Bank Stadium in Minneapolis, the new home of the NFL’s Minnesota Vikings. What follows here are some of the “sneak peek” photos we’re allowed to share with you in advance of our full report coming later this summer. For a more picturesque version of these photos, DOWNLOAD THE REPORT from our site!

vik1

Sunset shot of the “viking ship” stadium showing its proximity to downtown. Credit, all photos: Paul Kapustka, MSR

vik10

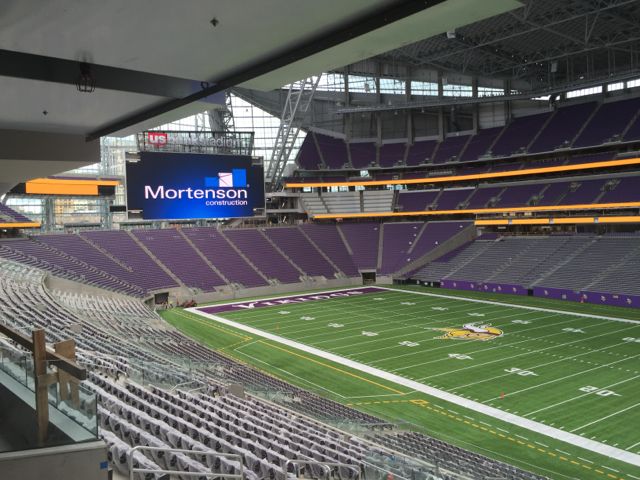
The other side of the stadium, where you can see the glass walls and the “viking ship” video board.

vik3

Inside on the main concourse — three concourses will have full 360 degree views of the field.

vik5

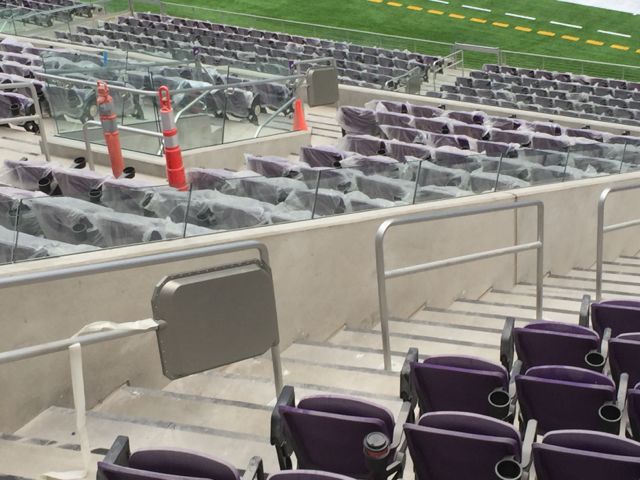
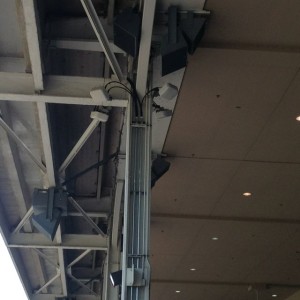
US Bank Stadium is using railing-mounted Wi-Fi APs to bring connectivity to the bowl — enclosure designed by Wi-Fi deployer AmpThink.

vik4

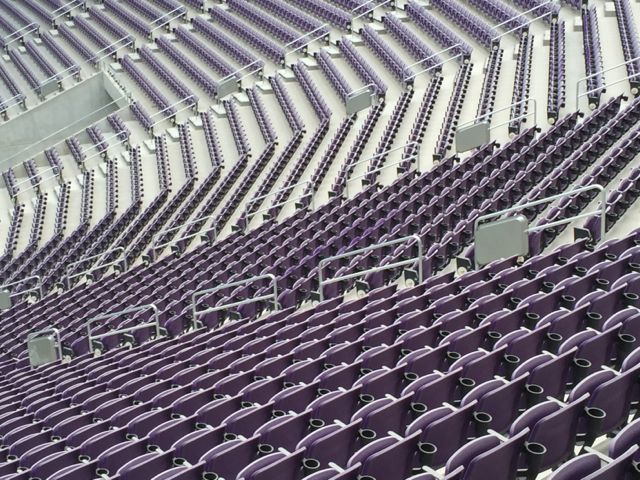
Wi-Fi enclosures do a good job of blending in with the purple-and-silver seating.

vik8

Yours truly with a selfie from the field-level suites. DOWNLOAD THE REPORT for more pictures!

New Report: US Bank Stadium sneak peek, Wi-Fi analytics and more!

DOC12Our newest STADIUM TECH REPORT features a look inside the Minnesota Vikings’ new home, US Bank Stadium, with a sneak peek photo essay ahead of the venue’s August opening dates. Also included in our latest issue is a feature on Wi-Fi analytics, as well as in-depth profiles of technology deployments at the St. Louis Cardinals’ Busch Stadium, and the Buffalo Bills’ Ralph Wilson Stadium.

Our Q2 issue for 2016 also has a big focus on DAS deployments, specifically at two venues with extra-large attendance issues — namely, the Kentucky Derby and the Daytona 500. You can get all this analysis and reporting by simply downloading a free copy of the report!

From its architecturally striking exterior to its sunny glass-walled interior, US Bank Stadium looks like a jewel for downtown Minneapolis. While we’ll have a full report on the technology inside a bit later this summer, you can feast your eyes on what we saw during a hard-hat tour of the stadium in early June.

On the Wi-Fi analytics side, you can hear from several leaders in stadium Wi-Fi implementations about how they are using data from their networks to improve the fan experience while also finding new ways to boost their own stadium businesses. Our profiles of Busch Stadium, Ralph Wilson Stadium and a bonus profile of the Los Angeles Coliseum all provide in-depth coverage of the unique challenges each one of these venues faces when it comes to technology deployments. And our DAS-focused coverage of deployments at Churchill Downs and Daytona International Speedway illustrate how expanded cellular coverage can provide enough connectivity when Wi-Fi isn’t an economic option. DOWNLOAD YOUR COPY of the report today and get this knowledge inside your head!

Mobilitie, AT&T beef up DAS coverage at Churchill Downs ahead of Kentucky Derby

White DAS antennas visible on the overhangs at Churchill Downs. Photo: Mobilitie (click on any photo for a larger image).

White DAS antennas visible on the overhangs at Churchill Downs. Photo: Mobilitie (click on any photo for a larger image).

Since it’s legal in horse racing, how about a bet? Who thinks the final AT&T DAS traffic total from the Kentucky Derby weekend will pass 10 terabytes this year? After hitting 5.1 TB during last year’s two days of racing, what are the odds on wireless data used there doubling down again? Anyone want to bet against growth?

For sure, operators of the wireless infrastructure at the track aren’t going to left behind for lack of trying — according to neutral-host DAS provider Mobilitie and DAS design partner AT&T, there will be approximately a 50 percent increase in AT&T’s cellular capacity at Churchill Downs this year, with double coverage in the 1900 MHz band compared to last year, according to AT&T.

Mobilitie president Christos Karmis said in a phone interview this week that “every year, the amount of data used has doubled,” at least since Mobilitie put in the first part of the DAS at the track for the 2013 event. Since then, Karmis said the DAS antenna count has grown from 253 to 290, and the network now has 55 sectors, in and around the track and seating areas as well as in the parking lots. In addition to AT&T, the DAS also carries traffic for Verizon Wireless and T-Mobile, neither of which have reported traffic totals from the event.

Biggest DAS in sports?

Where all the Kentucky Derby race-day social media posts go to find the Internet (aka the head end at the Churchill Downs DAS). Photo: Mobilitie

Where all the Kentucky Derby race-day social media posts go to find the Internet (aka the head end at the Churchill Downs DAS). Photo: Mobilitie

With race day drawing 170,513 fans last year, the Kentucky Derby may well be one of the most challenging events to provide wireless coverage to, with multiple spikes in traffic due to two full days of racing (there are 13 races scheduled for Friday May 6, the Kentucky Oaks Day, and 14 scheduled for Saturday May 7, the Kentucky Derby Day).

According to Karmis, the fans are mainly shooting video and taking pictures during the races, and then posting those images to social media networks during the breaks in between. And then there’s the betting, which can be done on premises via the twinspires app, which drives additional traffic. And then there’s the hats and fashion, which are worth lots of pictures themselves, especially if you see any celebrities during the red-carpet parade.

Though there is still a small amount of Wi-Fi in the main track buildings — at least there was a couple years ago when we did a profile on the new networks — the DAS is the workhorse at the venue, which spreads out far and wide and includes an infield area full of fans as well.

“It’s crazy to try to keep up” with the data demands, Karmis said.

With any luck on our side, we’ll be able to get Verizon and T-Mobile to send over their DAS stats after the event to see if the weekend of races can match the DAS total of 15.9 TB from Super Bowl 50. If the AT&T data alone has gone from 2 TB two years ago to 5.1 TB last year, what’s the total going to be for this year? Put your predictions in the comments below!

AT&T records 29.2 TB of cellular data during Coachella weekends

AT&T's new "drum" antennas at Coachella. Photos: AT&T.

AT&T’s new “drum” antennas at Coachella. Photos: AT&T.

For AT&T, the Coachella Valley Music and Arts Festival isn’t about sounds but about bandwidth: For the past few years, the cellular giant has tested some giant antennas to help connect the 75,000 concert fans who invade the venue in Indio, Calif., for two weekends in April, and this year those fans used up a total of 29.2 terabytes of data, according to AT&T, a new record for the provider at Coachella.

Last year AT&T rolled out something it called the cheese wheel antennas, basically big spheres with the tops and bottoms cut off, and a lot of antenna gear inside. With back-to-back 12 TB weekends, the cheese wheels as well as some drive-up cell towers on wheels (COWS) helped keep music fans connected at the concerts. This year, AT&T added to its antenna arsenal a beefier version of the cheese wheel it called the drum set, which helped record 18.6 TB of data the three days of the first weekend, and another 10.6 this past weekend, for a event total of 29.2 TB. For comparison, Super Bowl 50 back in February racked up a total of 26 TB of wireless traffic, with 10.1 TB on Wi-Fi and 15.9 TB on DAS.

Coachella’s AT&T data is all cellular, no Wi-Fi. In 2014, AT&T brought out its “big ball” antenna at Coachella, where AT&T has seen data usage grow by 20 times since 2011, through last year’s show. With this year’s total of 29.2 TB eclipsing last year’s 24 TB, there still seems to be no end in sight to the mobile-data usage at big events.