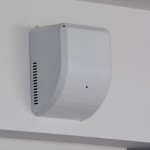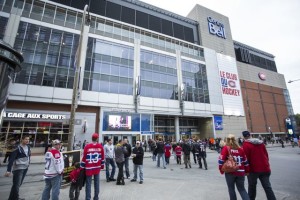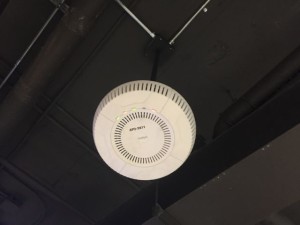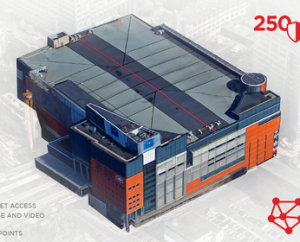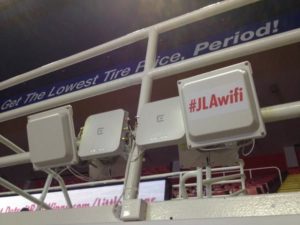
Wi-Fi antennas at Joe Louis Arena. Credit: Detroit Red Wings (click on any photo for a larger image)
While turning on a live network is certainly a great accomplishment, once the data starts flowing the inevitable questions follow: Now that we have Wi-Fi, what do we do with it? And how do we find out who’s using it, why they are using it, and how can we use that information it to find out better ways to improve the fan experience while also improving our business?
Those “step two” questions can only be answered by analytics, the gathering of information about Wi-Fi network performance and user activity. And while almost every live network operator almost instantly uses performance numbers to help tune the system, plans to harvest and digest the more personalized information like end-user identification, application use and fan engagement are just getting started, even at the most technically advanced stadiums with Wi-Fi networks in place.
What follows here are some conversations with stadium tech professionals who are already running fan-facing Wi-Fi networks, exploring how they use Wi-Fi metrics and analytics to both enhance the game-day experience for fans while also building a base of information that can be used by both technical staffs and marketing organizations inside the team, school and venue organizations.
Even this small sample seems to suggest that while Wi-Fi networks may be somewhat pervasive in the larger stadiums across the country, the harvesting and processing of data generated by digital fan engagement is just getting started, with plenty of unanswered questions and experiments that have yet to bear significant fruit. Yet everyone we spoke with also had an unshakable confidence that getting metrics and analytics right was the key to wireless success over the long haul, and all are fully engaged in pursuing that goal. It may take longer than physical deployment, but the “step two” of learning from the networks is well underway.
Detroit Red Wings: Pushing past the initial learning curve
Editor’s note: This profile is from our most recent STADIUM TECH REPORT, the Q2 issue which contains a feature story on Wi-Fi analytics, and a sneak peek of the Minnesota Vikings’ new US Bank Stadium. DOWNLOAD YOUR FREE COPY today!
Now that the Wi-Fi network at Joe Louis Arena in Detroit is coming up on its second birthday, Tod Caflisch said network administrators can relax a bit on game nights. Early on, however, he remembers “babysitting” the network during games, watching live performance stats to make sure everything was working correctly.
Watching the live network performance statistics, Caflisch said, “I could tell if there were issues. If throughput looked a little flat, we might have to reboot a switch. It was important, because there was so much at stake.”
As former director of information technology for the NHL’s Detroit Red Wings (he recently left Detroit and is now with the Minnesota Vikings), Caflisch helped drive the deployment of an Extreme Networks Wi-Fi network at the “Joe.” Though Joe Louis Arena is only going to host games a little while longer — a new downtown arena is just around the corner — Caflisch said the team in Detroit is already heading down the learning curve of interpreting analytics, with big goals on the horizon.
Right now, some of the most interesting network statistics have to do with fan Wi-Fi usage, including total tonnage, which Caflisch said hit 14 terabytes of data for the Red Wings’ home games this past season. That number is one and a half times bigger per game than the first year the network was in place, he said.
Big spikes for a score
One of the more interesting results came when Caflisch mapped network data to game action, an exercise that showed that hockey games may have bigger data spikes and troughs than other sports.
“We saw that traffic spikes corresponded with scores, and we also had huge spikes during intermissions,” Caflisch said. “And there were huge craters during the periods of regular action.”
While Caflisch said “it was kind of cool” to watch the network action mapped to the game action, in the future he sees the ability for the Red Wings use such actionable moments to better engage fans.
“There’s got to be some kind of marketing potential” to connect with fans during a network-activity spike, Caflisch said. What that is, is still unknown. But using networks to more closely engage fans is a big part of the Red Wings’ road map, especially as Detroit builds out a “venue environment” around the new arena.
According to Caflisch, the team in Detroit is planning to build out a network surrounding the arena, in parking lots and public spaces, including lots of beacons for proximity engagement. Though DAS and Wi-Fi numbers can show where foot traffic goes in and around stadiums, the next level of analytics Caflisch sees as important is on fan spending behavior, on items like parking, concessions and in restaurants and bars near the arena. Future projects in Detroit, he said, might include beacon-generated discounts, like a free coffee at a nearby Tim Horton’s or a free beer at a nearby bar.
“The kinds of things you want to find out are what kind of money are fans spending, and how often do they buy,” Caflisch said. “Do they stick around after the game? Do they rush in at the start? That’s the kind of stuff you’re looking for.”
Of course to get some of that data Caflisch knows the team needs to convince fans to engage digitally, by downloading a team app and providing some information for identification. So far some efforts in that direction have been helpful in identifying fans not in the team’s ticketing database, especially fans coming across the border from Canada.
In Detroit, Caflisch said, the Wings are “now marketing to those people, trying to get them to more games for the same or less money.”
Baylor University: Enlisting fans to help pinpoint problems
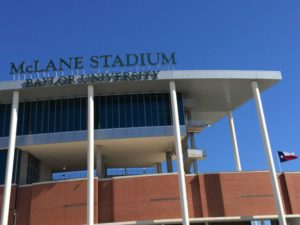
When Baylor University built its new football mecca, McLane Stadium, the stadium technology department was often as nervous as a football team before a big game. Would the new fan-facing Wi-Fi work as planned? Would they be able to solve problems before they became big problems?
“At the beginning, the questions we asked were along the lines of, ‘can we get through the day,’ ” said Pattie Orr, vice president for information technology and Dean of University Libraries and the public face of the McLane Stadium network. Now that the network team is a couple years into running stadium Wi-Fi, Orr can laugh a bit about the initial fears. But from the beginning, she said, analytics “were a big factor” in making sure the network was running right.An Extreme Networks deployment, Baylor uses Extreme’s Purview analytics system, which Orr lauds for being “easy to use” and a “great console for real-time information during a game.”
Solving for 2.4 GHz and using fan input
Mostly that means watching the dashboards to see if any APs are causing any errors, something the network stats package can usually show clearly. One of the things the network crew learned quickly during the first season with Wi-Fi was that Baylor fans were using a lot more 2.4 GHz Wi-Fi devices than anyone had thought, meaning that there were more older phones in use that didn’t have the newer 5 GHz Wi-Fi chips.
“The first season we were about 50-50 between 2.4 GHz and 5 GHz, and that surprised us,” said Bob Hartland, director of IT servers and networking services at Baylor. “We had to prioritize for more 2.4 GHz.” This past season, Hartland said, the fan devices skewed closer to 60 percent using 5 GHz bands.
Baylor also added Wi-Fi to its basketball arena this past season, presenting a whole new set of problems, like devices trying to connect to APs across the smaller stadium. Though network analytics were a start, Baylor’s team found out that fan input could also help isolate where problems might be from a physical standpoint. Having a team of “network coaches” on hand also helped pinpoint the problems in a way that might be impossible just working from the network side of things.This past year, Orr said Baylor added a feature to its stadium app to let fans “send a message to the Wi-Fi coach” with their row number and seat number if they were having a network problem. The coaches (part of most Extreme Wi-Fi deployments) also followed social media like Twitter to see if fans were reporting network problems.
“It’s fantastic to have the live [performance] data from your fans,” Orr said. With fan and network data and area knowledge in hand, the coaches and the network team could more quickly determine if it was a network or device problem, and respond more quickly to the issue. So more data = better solutions, faster.
“If you don’t have good access to analytics you can’t deal with fan [problems] in real time,” Orr said.
VenueNext and the Niners: Finding out who’s in the building
As one of the newer and more technologically advanced venues, Levi’s Stadium often gets noticed for its wireless networks, which set single-day records of 26 terabytes of data for combined DAS and Wi-Fi usage at Super Bowl 50.
Though wireless performance is important to teams and fans, the information being gathered by the Levi’s Stadium app — built by VenueNext, the company created by the Niners specifically to construct stadium apps — may end up being among the most valuable digital assets, since it helps teams discover exactly who is coming in the building and how they are spending time, attention and dollars.“We generate data for analytics,” said VenueNext CEO John Paul, talking about the role VenueNext plays as a stadium app partner. One of the more stunning facts revealed after the Niners’ first year at Levi’s Stadium was that via the stadium app, the team was able to increase its marketing database of fan names from 17,000 to 315,000, with even more impressive success in the details.
“We were able to find out things like how many games fans attended, and who they got the tickets from,” said Paul. Such data, he said, helps teams solve the classic problem of “having no idea who’s in the building on any given day.”
Knowing how many hot dogs can be delivered
While VenueNext’s value proposition may be centered on its ability to help teams gather such valuable marketing data, VenueNext itself relies on internal analytics to ensure the services its apps support — like express food ordering and in-seat food delivery — keep working smoothly during games.
After the first season at Levi’s Stadium, Paul said VenueNext learned that it needed to expose some of its data in real-time to fans — “to improve service during the event,” Paul said. One example is that now, if there are too many orders in a certain section, the app can send a message to fans that wait times might be longer than normal. Conversely, if a certain area of the stadium has idle kitchen capacity and runners, a team might send an in-app notification asking if fans want to order something, to create demand.
Over time, Paul said the VenueNext analytics might help teams find out where walk-up concession stands get overloaded by foot traffic, and maybe reconfigure stadium kitchen placements to assist with food delivery options. In the end, he said, it should be seamless to the fans, so that in-seat delivery becomes a regular part of a game-day experience.
“The fans should have no idea where the food comes from,” Paul said.
