Commentary: Cheer, Cheer for old Wi-Fi

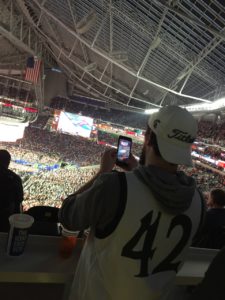
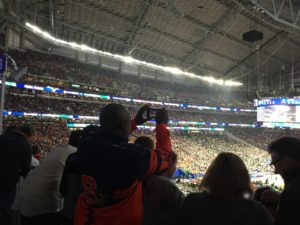
A hoops fan records action during the FInal Four at U.S. Bank Stadium. Credit all photos: Paul Kapustka, MSR (click on any picture for a larger image)

News item: Super Bowl 53 sees 24 terabytes of Wi-Fi data used.

Second news item: Final Four weekend sees 31.2 terabytes of Wi-Fi data used.

Even as people across the wireless industry seem ready to dig Wi-Fi’s grave, the view from here is not only is Wi-Fi’s imminent death greatly exaggerated, things may actually be heading in the other direction — Wi-Fi’s last-mile and in-building dominance may just be getting started.

The latest ironic put-down of Wi-Fi came in a recent Wall Street Journal article with the headline of “Cellphone Carriers Envision World Without Wi-Fi,” in which a Verizon executive calls Wi-Fi “rubbish.” While the article itself presents a great amount of facts about why Wi-Fi is already the dominant last-mile wireless carrier (and may just get stronger going forward) the article doesn’t talk at all about the Super Bowl, where Verizon itself basically turned to Wi-Fi to make sure fans at the big game who were Verizon customers could stay connected.

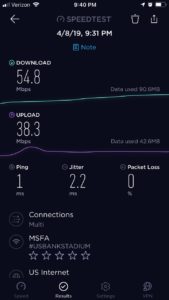
Wi-Fi speedtest from U.S. Bank Stadium during the Final Four championship game.

As readers of MSR know, the performance of the cellular DAS at Mercedes-Benz Stadium in Atlanta has been a question mark since its inception, and the emergence of competing lawsuits between lead contractor IBM and supplier Corning over its implementation means we may never learn publicly what really happened, and whether or not it was ever fixed. Though stadium tech execs and the NFL said publicly that the DAS was fine for the Super Bowl, Verizon’s actions perhaps spoke much louder — the carrier basically paid extra to secure part of the Wi-Fi network bandwidth for its own customers, and used autoconnect to get as many of its subscribers as it could onto the Wi-Fi network.

While we did learn the Wi-Fi statistics in detail — thanks to the fact that Wi-Fi numbers are controlled by the venue, not the carriers — it’s interesting to note that none of the four top cellular providers in the U.S. would give MSR a figure of how much cellular traffic they each saw in the stadium on Super Sunday. For the record, stadium officials said they saw 12.1 TB of data used on the Mercedes-Benz Stadium DAS on Super Bowl Sunday, a figure that represents the total traffic from all four carriers combined. But how that pie was split up will likely forever remain a mystery.

AT&T did provide a figure of 23.5 TB for Super Bowl traffic inside the venue as well as in a 2-mile radius around the stadium, and Sprint provided a figure (25 TB) but put even a less-measurable geographic boundary on it, meaning Sprint could have basically been reporting all traffic it saw anywhere inside the greater Atlanta city limits. Verizon and T-Mobile, meanwhile, both refused to report any Super Bowl cellular statistics at all.

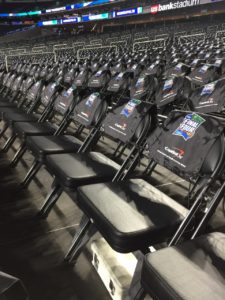
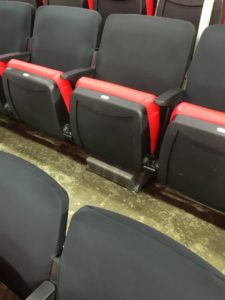
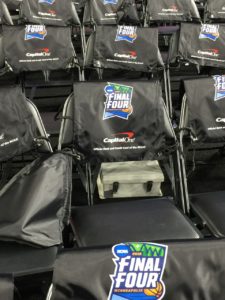
An under-seat Wi-Fi AP placement in the end zone seating at the Final Four.

Verizon also did not reply to a question about how much traffic it saw on the Verizon-specific Wi-Fi SSID inside the venue. While we get the marketing reasons for not reporting disappointing stats (why willingly report numbers that make you look bad?), it seems disingenious at best for one Verizon executive (Ronan Dunne, executive vice president and president of Verizon Wireless) to call Wi-Fi “rubbish” when another part of the company is relying heavily on that same rubbish technology to make sure its customers can stay connected when the cellular network can’t keep up. One man’s trash, I guess, is another division’s treasure.

Wi-Fi 6 and more spectrum on the way

For venue owners and operators, the next few years are likely going to be filled with plenty of misinformation regarding the future of wireless. The big carriers, who pull in billions each quarter in revenue, are staking their near-term future on 5G, a label for a confusing mix of technologies and spectrum chunks that is unlikely to be cleared up anytime soon. Unlike the celluar industry change from 3G to 4G — a relatively straightforward progression to a new and unified type of technology — the change to 5G has already seen carriers willing to slap the marketing label on a different number of implementations, which bodes many headaches ahead for those in the venue space who have to figure out what will work best for their buildings and open spaces.

There’s also the imminent emergence of networks that will use the CBRS spectrum at 3.5 GHz, which will support communications using the same LTE technology used for 4G cellular. Though CBRS has its own challenges and hurdles to implementation, because it is backed by carriers and the carrier equipment-supply ecosystem, you can expect a blitz of 5G-type marketing to fuel its hype, with poor old Wi-Fi often the target for replacement.

While the Wi-Fi Alliance and other industry groups rallying around Wi-Fi might seem like the Rebel Alliance against a First Order dreadnought, if I’ve learned anything in my career of technology reporting it’s that you should never bet against open standards. I’ve been around long enough to see seemingly invincible empires based on proprietary schemes collapse and disappear under the relentless power of open systems and standards — like Ethernet vs. DEC or IBM networking protocols, and TCP/IP vs. Novell — to count out Wi-Fi in a battle, even against the cellular giants. In fact, with the improvements that are part of Wi-Fi 6 — known also as 802.11ax in the former parlance — Wi-Fi is supposed to eventually become more like LTE, with more secure connections and a better ability to support a roaming connection and the ability to connect more clients per access point. What happens then if LTE’s advantages go away?

With Wi-Fi 6 gear only now starting to arrive in the marketplace, proof still needs to be found that such claims can work in the real world, especially in the demanding and special-case world of wireless inside venues. But the same hurdles (and maybe even more) exist for CBRS and 5G technologies, with big unanswered questions about device support and the need for numerous amounts of antennas that are usually ignored in the “5G will take over the world soon” hype stories. I’d also add to that mix my wonder about where the time and talent will come from to install a whole bunch of new technologies that will require new learning curves; meanwhile, as far as I can tell the companies supporting Wi-Fi continue to add technology pros at ever-growing user and education conferences.

So as we ready for the inevitable challenge of sifting through cellular FUD and hype let’s have a cheer for good old Wi-Fi — for now the champion of the biggest data-demand days in venues, and maybe the leader for years to come.
Minnesota United MLS home opener at Allianz Field sees 85 GB of Wi-Fi

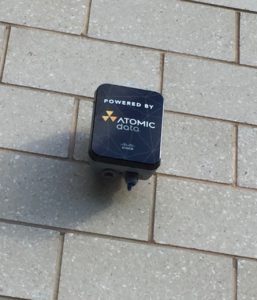
One of the Cisco Wi-Fi APs installed by Atomic Data inside the new Allianz Field in Minneapolis. Credit: Paul Kapustka, MSR (click on any picture for a larger image)

A chilly home opener for the Minnesota United soccer team in their brand-new Allianz Field saw 85 gigabytes of data used on the stadium’s Wi-Fi network, according to statistics provided by Atomic Data, the stadium’s technology provider.

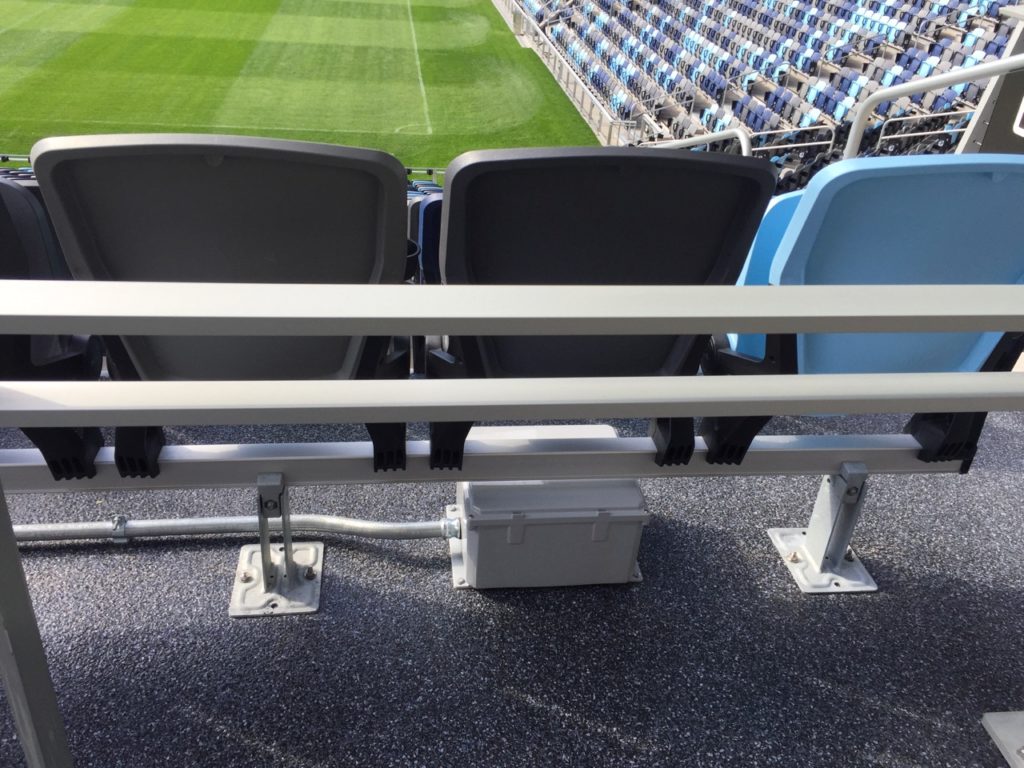
With 19,796 fans on hand on April 13 to pack the $250 million venue, Atomic Data said it saw 6,968 unique Wi-Fi device connections, a 35 percent take rate. The Allianz Field Wi-Fi network uses Cisco gear with 480 Wi-Fi APs installed throughout the venue. Approximately 250 of those are located in the seating bowl, with many installed under-seat. The stadium also has a neutral-host DAS built by Mobilitie, though none of the wireless carriers are currently online yet. (Look for an in-depth profile of the Allianz Field network in our upcoming Summer STADIUM TECH REPORT issue!)

According to the Atomic Data figures, the stadium’s Wi-Fi network saw peak Wi-Fi bandwidth usage of 1.9 Gbps; of the 85 GB Wi-Fi data total, download traffic was 38.7 GB and upload traffic was 46.3 GB. Enjoy some photos from the opening game (courtesy of MNUFC) and a couple from our pre-opening stadium tour!

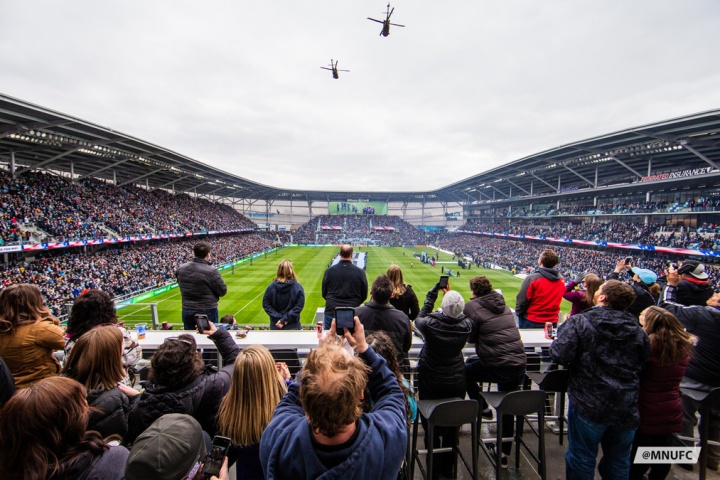
The game was opened with a helicopter fly-by


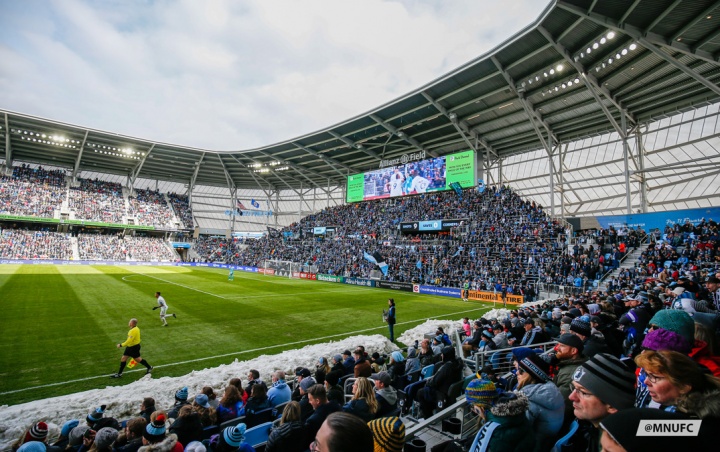
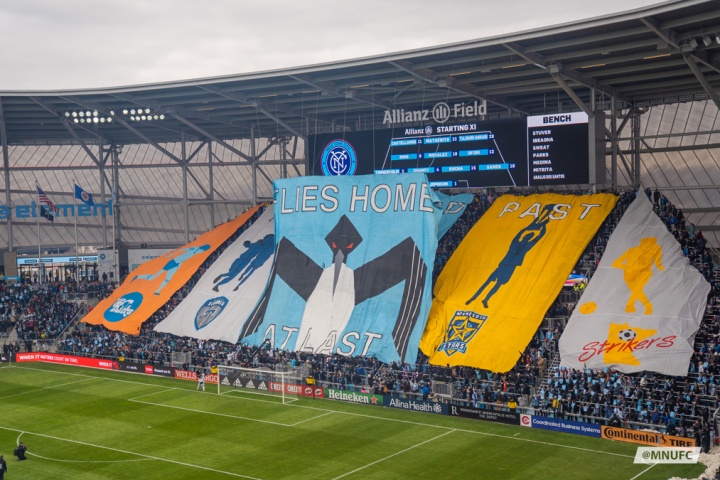
A look at the standing-area supporter end zone topped by the big Daktronics display

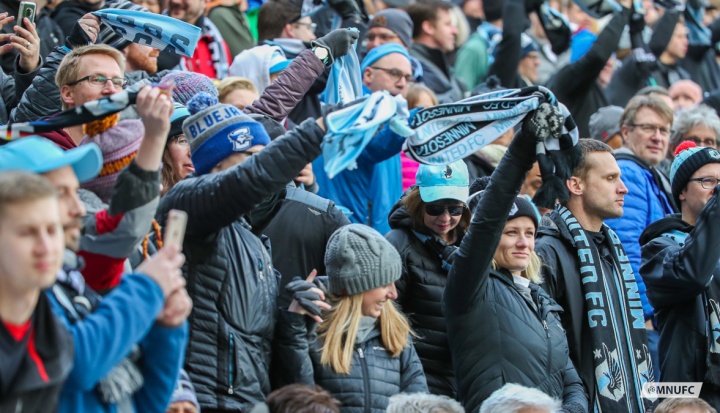
The traditional soccer scarves were handy for the 40-degree temperatures

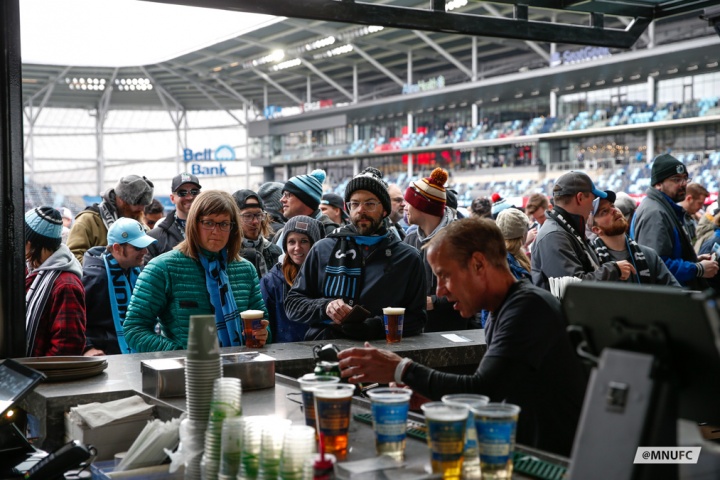
A view toward the field through the brew house window

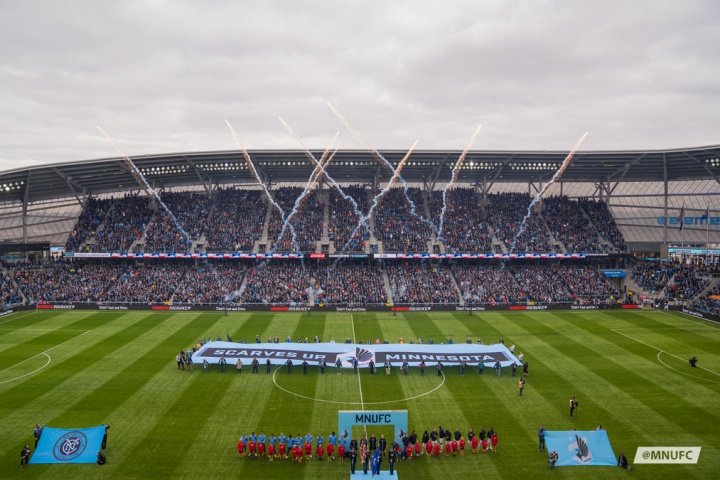
The main pitch gets its opening salute

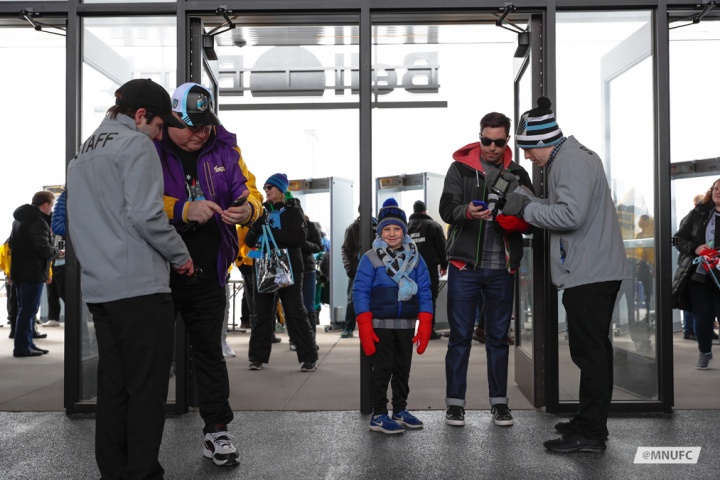
Entry ways were well covered with Wi-Fi to power the all-digital ticketing

The Loons have a roost!

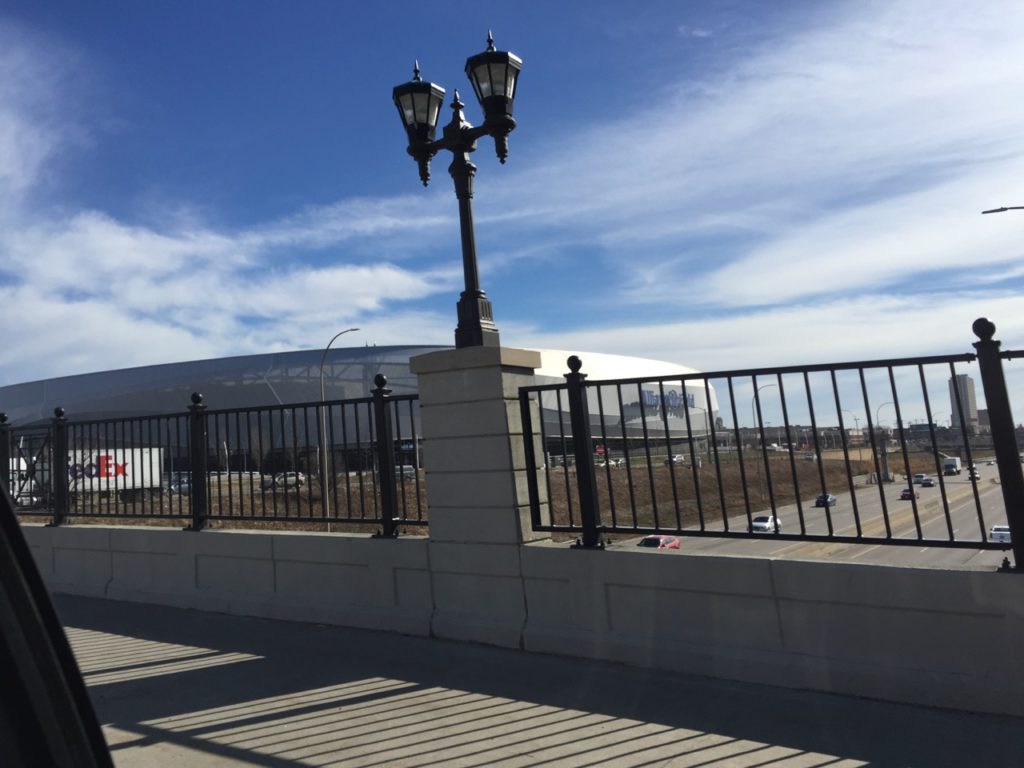
The view as you approach the stadium crossing I-94

One of the under-seat Wi-Fi AP deployments

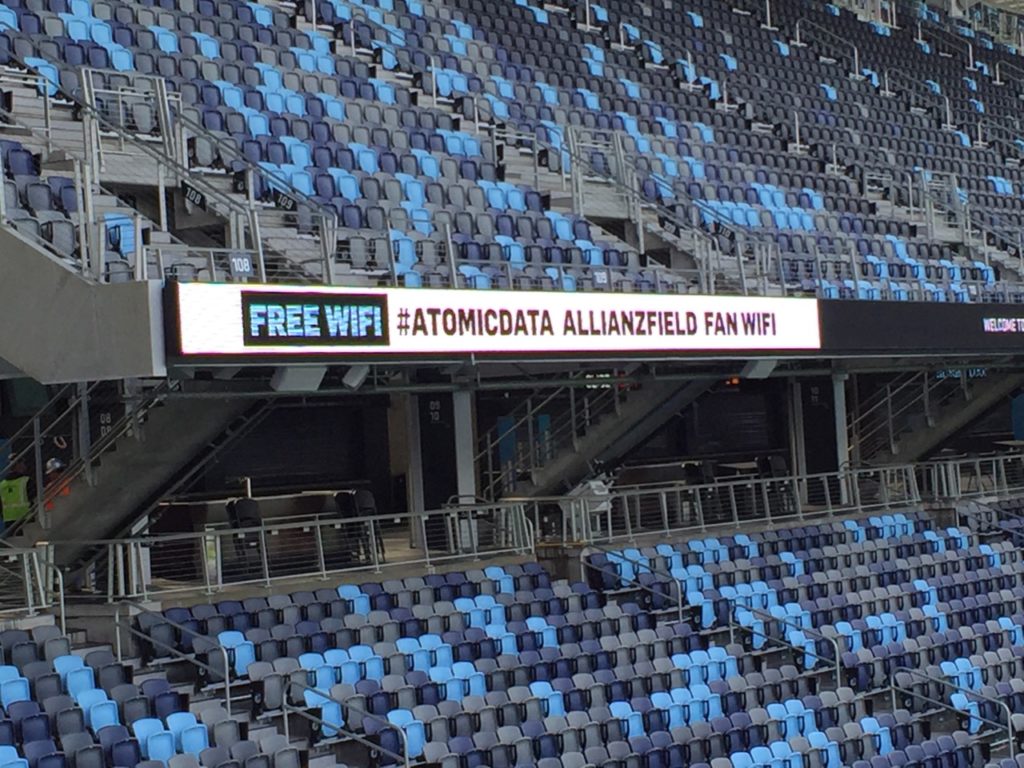
Message boards let fans know how to connect

U.S. Bank Stadium sees 31.2 TB of Wi-Fi data used during Final Four weekend

The Final Four generated record Wi-Fi totals this year at U.S. Bank Stadium in Minneapolis. Credit all photos: Paul Kapustka, MSR (click on any picture for a larger image)

Fans at this year’s NCAA Men’s Final Four basketball tournament at U.S. Bank Stadium in Minneapolis used more than 31 terabytes of data on the Wi-Fi network during the championship weekend, with stadium records set in total single-day Wi-Fi usage and sustained data rates, and overall records set for concurrent connections and unique connections, according to figures from the NCAA.

The semifinal matches on April 6 between Auburn and Virginia and Texas Tech and Michigan State saw fans use the second-highest single-day Wi-Fi total we have seen reported, with 17.8 TB of data used. The Wi-Fi total surpassed the 16.31 TB of Wi-Fi data used in the same stadium during Super Bowl 52 on Feb. 4, 2018; only Super Bowl 53 this year at Mercedes-Benz Stadium in Atlanta, with 24.05 TB of Wi-Fi used, has seen a bigger data day (according to our unofficial list of such data events).

According to the NCAA figures, the network saw 51,227 unique users on Final Four Saturday, out of 72,711 in attendance. The 70 percent take rate just beats the 69 percent take rate seen at Super Bowl 53, an overall sign perhaps that bucket-event fans are increasingly turning to stadium Wi-Fi for connectivity. At Super Bowl 52 in U.S. Bank Stadium, there were 40,033 unique users on the Wi-Fi network (out of 67,612 in attendance), a take rate of 59 percent.

A familiar scene at the FInal Four — a fan recording their experience

The peak concurrent user number from Final Four Saturday of 31,141 was also an overall record, beating Super Bowl 53’s mark of 30,605. (Super Bowl 53 had 70,081 fans in attendance for the Feb. 3 game between the New England Patriots and the Los Angeles Rams.) The Wi-Fi network numbers for Monday’s championship game (won by Virginia 85-77 over Texas Tech in overtime) saw big numbers itself, with 13.4 TB of total data used, and 48,449 unique connections and 29,487 peak concurrent users (out of 72,062 in attendance). Monday’s game also produced a peak throughput number of 11.2 Gbps just after the game ended. The total official Wi-Fi data used during the semifinals and final was 31.2 TB.

According to stadium network officials, there were 1,414 active Cisco access points for the Final Four games, with some permanent Wi-Fi APs not being used because they were covered by the temporary seats that extended out to the court built in the middle of where the football field usually is. However, the temporary seating was covered by an additional 250 APs and 50-plus switches in a temporary network built by AmpThink and the stadium network team (look for a deeper profile of the temporary network in our upcoming Summer STADIUM TECH REPORT issue!).

Speed tests taken by Mobile Sports Report showed robust Wi-Fi connectivity all around the venue on both days, with marks like a 48.6 Mbps download and 44.0 Mbps upload in the higher seating section during pregame for Saturday’s events, another mark of 45.3 Mbps / 38.7 Mbps on the third-level main concourse close to Saturday’s tipoff, and a mark of 54.8 Mbps / 38.3 Mbps on the main lower-level concourse just after tipoff of Monday’s championship game.

One of the temporary seating under-seat Wi-Fi APs

“The traffic we experience on Wi-Fi networks at the Final Four is considerable each year, and Minneapolis was no exception,” said David Worlock, director of media coordination and statistics for the NCAA tournament. “We were completely satisfied with the performance of the network throughout the weekend.”

THE MSR TOP 20 FOR WI-FI

1. Super Bowl 53, Mercedes-Benz Stadium, Atlanta, Ga., Feb. 3, 2019: Wi-Fi: 24.05 TB
2. NCAA Men’s 2019 Final Four semifinals, U.S. Bank Stadium, Minneapolis, Minn., April 6, 2019: Wi-Fi: 17.8 TB
3. Super Bowl 52, U.S. Bank Stadium, Minneapolis, Minn., Feb. 4, 2018: Wi-Fi: 16.31 TB
4. NCAA Men’s 2019 Final Four championship, U.S. Bank Stadium, Minneapolis, Minn., April 8, 2019: Wi-Fi: 13.4 TB
5. 2018 College Football Playoff Championship, Alabama vs. Georgia, Mercedes-Benz Stadium, Atlanta, Ga., Jan. 8, 2018: Wi-Fi: 12.0 TB*
6. Super Bowl 51, NRG Stadium, Houston, Feb. 5, 2017: Wi-Fi: 11.8 TB
7. Atlanta Falcons vs. Philadelphia Eagles, Lincoln Financial Field, Philadelphia, Pa., Sept. 6, 2018: Wi-Fi: 10.86 TB
8. Super Bowl 50, Levi’s Stadium, Santa Clara, Calif., Feb. 7, 2016: Wi-Fi: 10.1 TB
9. Taylor Swift Reputation Tour, Gillette Stadium, Foxborough, Mass., July 27, 2018: Wi-Fi: 9.76 TB
10. Minnesota Vikings vs. Philadelphia Eagles, NFC Championship Game, Lincoln Financial Field, Philadelphia, Pa., Jan. 21, 2018: Wi-Fi: 8.76 TB
11. Jacksonville Jaguars vs. New England Patriots, AFC Championship Game, Gillette Stadium, Foxborough, Mass., Jan. 21, 2018: Wi-Fi: 8.53 TB
12. Taylor Swift Reputation Tour, Broncos Stadium at Mile High, May 25, 2018: Wi-Fi: 8.1 TB
13. Kansas City Chiefs vs. New England Patriots, Gillette Stadium, Foxborough, Mass., Sept. 7, 2017: Wi-Fi: 8.08 TB
14. SEC Championship Game, Alabama vs. Georgia, Mercedes-Benz Stadium, Atlanta, Ga., Dec. 1, 2018: Wi-Fi: 8.06 TB*
15. Green Bay Packers vs. Dallas Cowboys, Divisional Playoffs, AT&T Stadium, Arlington, Texas, Jan. 15, 2017: Wi-Fi: 7.25 TB
16. Stanford vs. Notre Dame, Notre Dame Stadium, South Bend, Ind., Sept. 29, 2018: 7.19 TB
17. (tie) Southern California vs. Notre Dame, Notre Dame Stadium, South Bend, Ind., Oct. 21, 2017: 7.0 TB
Arkansas State vs. Nebraska, Memorial Stadium, Lincoln, Neb., Sept 2, 2017: Wi-Fi: 7.0 TB
18. WrestleMania 32, AT&T Stadium, Arlington, Texas, April 3, 2016: Wi-Fi: 6.77 TB
19. Wisconsin vs. Nebraska, Memorial Stadium, Lincoln, Neb., Oct. 7, 2017: Wi-Fi: 6.3 TB
20. Super Bowl 49, University of Phoenix Stadium, Glendale, Ariz., Feb. 1, 2015: Wi-Fi: 6.23 TB

* = pending official exact data

Little Caesars Arena revs the engine on wireless

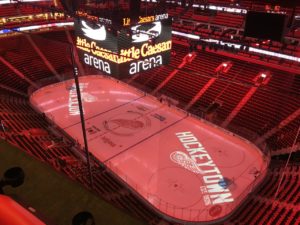
Little Caesars Arena in Detroit is revving its engine with wireless deployments of Wi-Fi and DAS. Credit all photos: Terry Sweeney, MSR (click on any picture for a larger image)

Detroit has made an ambitious bet on the sports entertainment model with its 50-block District Detroit development – which embraces Ford Field (where the NFL’s Lions play), Comerica Park (MLB’s Tigers) and most recently, Little Caesars Arena (NBA’s Pistons and NHL’s Red Wings).

In fact, Motor City might just as easily be renamed Stadium City as Detroit looks to professional sports as one cornerstone of economic re-development.

The city has all four major pro sports teams competing within a few blocks of each other, noted John King, vice president of IT and innovation for Olympia Entertainment and the Detroit Red Wings. District Detroit plays host to more than 200 events, welcoming some 3 million visitors annually – not bad for an area that’s barely 18 months old.

Detroit’s hardly alone in riding this development wave. Sports entertainment districts are a proven engine to boost local economies and are popping up all over the country:
–Los Angeles’s LA Live complex uses the Staples Center as its hub but includes restaurants, hotels and plenty of retail;
–Houston Avenida gangs together Minute Maid Park, BBVA Compass Stadium and NRG Stadium, along with a convention center and hotels;
–Battery Atlanta houses the Atlanta Braves’ SunTrust Park and a Coca-Cola entertainment facility, along with retail, residences and hotels;
— Westgate Entertainment District in the greater Phoenix area houses State Farm Stadium (NFL’s Cardinals) and Gila River Arena (NHL’s Coyotes), plus the obligatory retail, restaurants and hotels.

San Francisco, Kansas City, Cincinnati and Sacramento and other cities are all building out similar sports entertainment developments in their downtown areas that encourage sports fans to make a night of it, or even a weekend. Even venerable venues like Green Bay’s Lambeau Field and Chicago’s Wrigley Field are also getting in the act of trying to build areas outside the parks to keep fans engaged (and spending) before and after events, or even when there’s no games being played.

Robust DAS, Wi-Fi in LCA

Editor’s note: This report is from our latest STADIUM TECH REPORT, an in-depth look at successful deployments of stadium technology. Included with this report is a profile of the new Wi-Fi and DAS networks being planned for the University of Colorado, as well as a profile of Wi-Fi at Vivint Smart Home Arena in Salt Lake City! DOWNLOAD YOUR FREE COPY now!

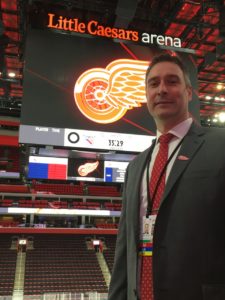
John King oversees the IT operations at Little Caesars Arena

King is pleased with the performance of the IT infrastructure at Little Caesars Arena since the $863 million venue opened in the fall of 2017. With a backbone of two 100-Gbps fiber connections, the arena counts more than 700 Cisco Wi-Fi access points. There are 364 APs in the bowl itself; the bulk of those – 300 APs – have been installed under seats to get the signals closer to where the users are.

Mobile Sports Report put LCA’s Wi-Fi network and DAS system to the test this season during a Red Wings home game against the New York Rangers. Due to personal technical constraints, we were only able to test Verizon’s portion of the DAS deployment; the Wi-Fi network tested was the District Detroit Xfinity SSID.

The good news is that both network types performed admirably. No surprise that bandwidth was most plentiful and speeds were fastest on concourses near concessions, as well as in the private clubs parceled around LCA. Fastest measured speeds: 139.68 Mbps download/33.24 Mbps on the DAS network outside the MotorCity Casino Club. The Wi-Fi was also well engineered there – 51.89 Mbps download and 72.34 Mbps upload were plenty fast for hockey’s power users.

We measured comparable speeds by the Rehmann Club with 134.4 Mbps/36.25 Mbps on the DAS, and 21.56 Mbps/120.8 Mbps on Wi-Fi. Similarly, connectivity was not an issue while standing in front of the impossible-to-miss Gordie Howe statue in LCA’s main concourse, where we clocked DAS at 102.95 Mbps/22 Mbps, and Wi-Fi at 43.34 Mbps/43.72 Mbps.

Speeds around the arena were generally in double-digit megabits, both for Wi-Fi and DAS. The Wi-Fi signal got a little sluggish in Section M7 (0.79 Mbps/3.03 Mbps) and Section M33 (1.68 Mbps/29 Mbps). Lowest measured throughput on the DAS network was in Suite 17 with 16.18 Mbps/17.41 Mbps, still plenty fast to handle most fan requirements.

Lighting Things Up in District Detroit

In tandem to LCA, there are approximately 1,000 APs also attached to the network that either handle District Detroit’s public Wi-Fi or connect to 34 parking lots and garages.

Wireless gear painted to blend in

“Our goal is to bring life and excitement throughout the District and not just focus on Little Caesars Arena,” King said. Video and digital signage are essential to that effort, both inside and outside LCA. The network enables more than 1,500 IPTV connections distributed across the arena, but also externally to LED boards and electronic parking signs. “We want to take the excitement from the event and run it out to the city – ‘5 minutes to puck drop’, on all those signs as one example,” King explained. “We can leverage [signage] for more than just the price of parking.”

The network uses the Cisco Vision IPTV digital display management system to control display programming, including advertising that appears on video screens in LCA’s many hospitality suites. With five TV screens per suite, LCA deploys an L-shaped “wrapper” around the main video image used for advertising. “We rotate that content in the suites and run loops in concourse before and after events,” King said. “It allows us to put scripting in different zones or post menus and dynamically update prices and items for sale.” LCA’s concessionaires can change the price or location of food and beverage items, all through the networked point-of-sale system.

Tune-able Wi-Fi

The District Detroit app is divided into three “buckets,” according to King: Detroit Red Wings, Detroit Pistons and 313 Presents — all the events and entertainment outside of sporting events (313 is Detroit’s area code). When configured for hockey, LCA can accommodate up to 19,515 Red Wings fans; as a basketball arena for the Pistons, LCA holds 20,491. But some events may draw fewer people and King and his team adjust accordingly.

“We’re an arena for 20,000 fans and as we looked at that density, we found that 10,000 fans behave differently and we’ve had to tune the arena differently based on traffic flows,” he said. When completely full, Wi-Fi signals must pass through so many “bags of water,” as RF engineers sometimes describe human spectators. Half as many fans means that Wi-Fi signals behave differently, consequently, a fan may connect to an AP that’s less than ideal, which can affect both user experience and system performance.

An under-seat Wi-Fi enclosure

“We’ve looked at some power tweaks and tuning; we also have the ability to tune [the arena] on the fly,” King said, but emphasized that the venue’s Wi-Fi doesn’t get re-tuned for every event. “We try to find the sweet spot and not do that too much. On an event day, we try not to touch anything that isn’t broken,” he said.

Previews of coming attractions

Like any sports and entertainment IT exec, King is looking at ways to improve the fan experience and derive more performance and revenue from Olympia’s IT investment. Buoyed by the success of mobile ticketing at LCA, King said he’d like to find some way to use biometrics to help speed up transactions at counters and pedestals throughout the arena. And he’s excited about 5G cellular deployment, which he believes could compete with Wi-Fi if 5G delivers on all that’s been promised by carriers.

LCA’s app uses Bluetooth for navigation, letting fans input their seat information for directions. “Right now, we have pre-order pickup, but in-seat service is something we’re looking at. What other line-busting technologies can we do?” King said.

And while fans can pre-order food and beverages at LCA, King also wonders if pre-ordering of team merchandise (“merch”) is something that would appeal to fans and be easy to execute. “We’re looking at a Cincinnati venue where they have compartments for food, hot or cold, that’s been pre-ordered,” he said, wondering if a similar compartmentalized pickup system be used for merch.

King sees plenty of room for improvement in overall management reporting across IT systems at LCA and the 12,000 active ports that keep systems humming.

“Everything is connected and our electricians can use their iPads to dim or turn on lights anywhere in the building,” he said, adding that everything’s monitored — every switch, every port. “It would be nice to see more information around traffic flow and performance patterns. We’re seeing a little bit of that. But I’d like to see network information on people tracking and doors, and correlate visual information with management data.”

Another set of metrics King can’t get at the moment: Performance data from AT&T, T-Mobile and Verizon about LCA’s 8-zone DAS system. King said he’s talking with Verizon, the lead DAS operator at the venue, about getting autonomous reports in the future, but for the time being King and his team don’t have much visibility there. The DAS uses the Corning ONE system.

Venue Display Report: Sharks bring ‘excitement’ to SAP Center concourses with new digital display technology from Daktronics and Cisco

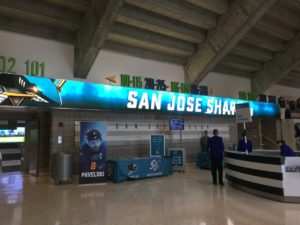
A long LED board lights up the main concourse at the San Jose Sharks’ home, SAP Center. Credit all photos: Paul Kapustka, MSR (click on any picture for a larger image)

If you’re an ice hockey fan, you are no doubt somewhat addicted to the excitement of seeing games live, in person. Yet one historical drawback to going to games has always been fearing those moments when you need or want to leave your seat, when missing out on the unpredictable action makes waiting in lines excruciating.

While many teams in all kinds of sports have been busy installing television screens in concourses and concession areas to help keep fans connected to the live action, at SAP Center in San Jose the NHL’s Sharks have taken concourse display technology to a new level: With cutting-edge LED displays from Daktronics and the Cisco Vision IPTV display management system from Cisco, the Sharks have turned what used to be basically a dark concrete tunnel into a well-lit, display-laden walkway that can bring live game action and exciting, engaging marketing messages to fans while they are outside the bowl, keeping the excitement level high no matter where in the building a fan might be.

The most visible part of the new display deployment, one installed in phases over the last two seasons, are the concourse LED boards from Daktronics, displays that were custom designed for the stadium’s walkways. Robin Hall, a regional manager for the Brookings, S.D.-based Daktronics, said there were a total of 17 displays added to the main concourse at SAP Center, all 3 1/2-feet tall but in many different widths, with one measuring almost 66 feet wide.

Narrow Pixel Pitch LEDs make a difference

Editor’s note: This profile is from our new VENUE DISPLAY REPORT series, a vertical-specific offering of MSR’s existing STADIUM TECH REPORT series. The VENUE DISPLAY REPORT series will focus on telling the stories of successful venue display technology deployments and the business opportunities these deployments enable. No registration or email address required — just click on this link and start reading!

John Castro, vice president of corporate partnerships for the Sharks, said the concourse displays are just the latest step in an ongoing process to “keep the venue updated and modernized.” Now celebrating its 25th year in existence, SAP Center recently hosted the NHL’s All-Star Game and is a regular stop for such big-ticket events as NCAA basketball regionals and U.S. Figure Skating championships.

In 2010, Castro said the arena added a new Daktronics center-hung video board, which has distinctive circular ribbon boards above and below that synchronize with the ribbon board that circles the arena in the middle of the seating areas. A few years ago, the arena put out an RFP to bring Wi-Fi to the stadium, and when it picked Cisco for the gear supplier, it also decided to use Cisco Vision to synchronize a new display strategy for the building’s main concourse.

“The idea was, let’s emulate what people see in the seats and bring it to the concourse,” Castro said.

A new LED screen above an entryway

What was eventually installed over the past two seasons were the new wall-mounted displays, which joined the 240 TV screens and the 16 hanging pendant displays (with six screens each) that were already in the concourses. According to Castro the Sharks took down eight static signs to make room for the new, interactive displays.

All the new displays make use of Daktronic’s new Narrow Pixel Pitch (NPP) technology, which feature 2.5-millimeter line spacing. The close alignment of the LED lights in the displays makes them sharp even from close distances, with a look and feel more like a traditional TV screen than an LED ribbon board.

By using LED technology, not only are the boards more flexible in what kind of content they can carry, but they are also cheaper and more resilient than TV screens, something Hall said matters a lot to venues like SAP Center that may see up to 300 live events a year.

“If you have TVs, you have to replace them often, and over a lot of hours [the expense] is hard to justify,” said Hall. With its LED technology, Daktronics was able to create custom size boards to fit different areas in the concourse (like above the entry and exit doorways, or above the main entry openings to the seating bowl), giving the Sharks lots of flexibility to build their new concourse viewing experience.

Bringing Cisco Vision to control displays

To make fans take notice of the new displays, the Sharks turned to Cisco and its Cisco Vision IPTV display management system, which allows teams and venues to program and run multiple displays from a single management system. Cisco also brings to the table years of experience in designing, deploying and selling display systems and system content, which can help teams like the Sharks not only keep fans more engaged but also help the team improve its digital ad sales.

Cisco, which supplied the Wi-Fi gear when SAP Center got its new wireless networks a couple years ago, teamed up with network deployment partner AmpThink to deploy a new display system at the same time, often doubling up on infrastructure. At many points inside the arena, a display screen is mounted in the same space as a Wi-Fi access point, an efficient design that combines aesthetics (the APs are hidden behind the screens) with cost savings.

Menu screens and live action are side-by-side to keep fans engaged

According to Ken Martin, executive director of digital transformation for the consumer industries in the Americas and for the sports and entertainment industry globally at Cisco, the Sharks’ previous display system was limited in its capabilities, especially in the ability to change things like menu boards easily between events. Martin also said the Sharks had four different signage solutions for the various boards and displays throughout the stadium, making it hard to coordinate programming across screens.

Now with Cisco Vision in place, the Sharks can build “shows” of content and advertising that flow from screen to screen, or arrive simultaneously on multiple screens to increase the visual effect. Inside the SAP Center concourses, the new Daktronics panels combine with an previously existing infrastructure of screen displays hanging over the walkways to create a visual “wall” that draws the eye.

“The way [the screens] are positioned, you cannot stand in the SAP Center concourses without being hit by something,” Cisco’s Martin said.

The Sharks’ Castro said there “was a lot of discussion and research” about the placement of the signs.

“Whether you turn left or right, you’re always going to see an LED,” Castro said.

How to use digital displays to entertain and inform

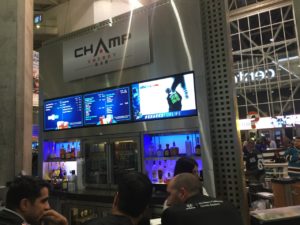
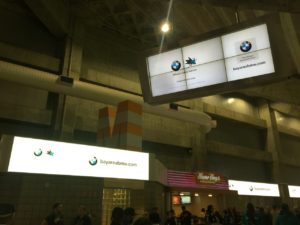
Through its professional services that are part of the Cisco Vision deal, Cisco also helps the Sharks brainstorm with potential sponsors to create digital display advertising ideas, and then also helps create, produce and run the “show” of ads that streams across all the stadium’s displays. A current campaign with BMW is an example of using all concourse screens simultaneously to create an immersive feel to the advertising.

A look at the hanging pendant screens in sync with the LED wall boards

“Part of what we do is show customers the art of the possible,” said Martin, who said many demonstrations of digital-display potential can happen in his team’s extensive demo room at Cisco, where they have 27 different types of screens to model just about any possible stadium deployment. Though much of the digital advertising industry in venues is still in an adolescent stage, Martin said that sponsors are “way more educated than they have ever been,” and know now that they can ask for particulars like having ads shown at certain times, or to have advertising content “wrapped” around live action on partial screen real estate, like an “L-wrap.”

With Cisco Vision, the Sharks are able to not just coordinate a “show” of ads and other content during the game, but they can also break in and trigger special screen content when something happens live, like a goal being scored. Such “takeover” moments are just another new asset that can be added to the ROI for a smart digital display solution, something not possible with static display systems. Such timely messages can really catch the fans’ eye, especially so at hockey games where people pay attention when they aren’t in their seats.

“If you’re a true hockey fan, you have your concourse timing down to a science,” said Daktronic’s Hall. “You never want to go to the game and feel like you’re missing something.”

To help those fans, one of the live action content pieces run across most of the concourse boards at SAP Center is a live clock that counts down the time until live action starts again.

“It can really be a showstopper, to use the screens and video walls, especially when they are all synchronized to the same message,” Cisco’s Martin said. “You’re going to get people to stop and pay attention.”

For the Sharks, the new system is already returning dividends; according to Castro, some 80 percent of all new digital display sponsorship business includes Cisco Vision integration as part of the opportunity.

“It helps [ads] rise above the clutter,” Castro said of the new display system. “You can see the impact on the brands as well as on the fans.”

“It’s like putting on a show in the concourse,” Daktronic’s Hall said of the new system. “It really extends the in-bowl experience through the whole venue.”

Editor’s note: This profile is from our new VENUE DISPLAY REPORT series, a vertical-specific offering of MSR’s existing STADIUM TECH REPORT series. The VENUE DISPLAY REPORT series will focus on telling the stories of successful venue display technology deployments and the business opportunities these deployments enable. No registration or email address required — just click on this link and start reading!

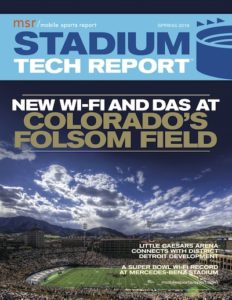
New Report: Record Wi-Fi at Super Bowl 53, and Wi-Fi and DAS for Colorado’s Folsom Field

MOBILE SPORTS REPORT is pleased to announce the Spring 2019 issue of our STADIUM TECH REPORT series, the ONLY in-depth publication created specifically for the stadium technology professional and the stadium technology marketplace.

Our string of historical in-depth profiles of successful stadium technology deployments continues with reports from the record-setting Wi-Fi day at Super Bowl 53, a look at the network performance at Little Caesars Arena, plans for Wi-Fi and DAS at the University of Colorado and more! Download your FREE copy today!

We’d like to take a quick moment to thank our sponsors, which for this issue include Mobilitie, JMA Wireless, Corning, Boingo, MatSing, and Cox Business/Hospitality Network. Their generous sponsorship makes it possible for us to offer this content free of charge to our readers. We’d also like to welcome readers from the Inside Towers community, who may have found their way here via our ongoing partnership with the excellent publication Inside Towers. We’d also like to thank the SEAT community for your continued interest and support.