Wi-Fi scores like Villanova during Final Four at Alamodome

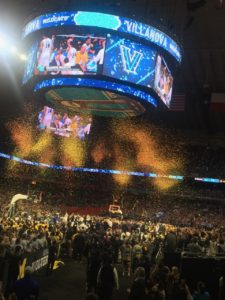
Confetti rains down from the scoreboard after Villanova beat Michigan in this year’s Final Four championship game at the Alamodome in San Antonio, Texas. Credit all photos: Paul Kapustka, MSR (Click on any photo for a larger image)

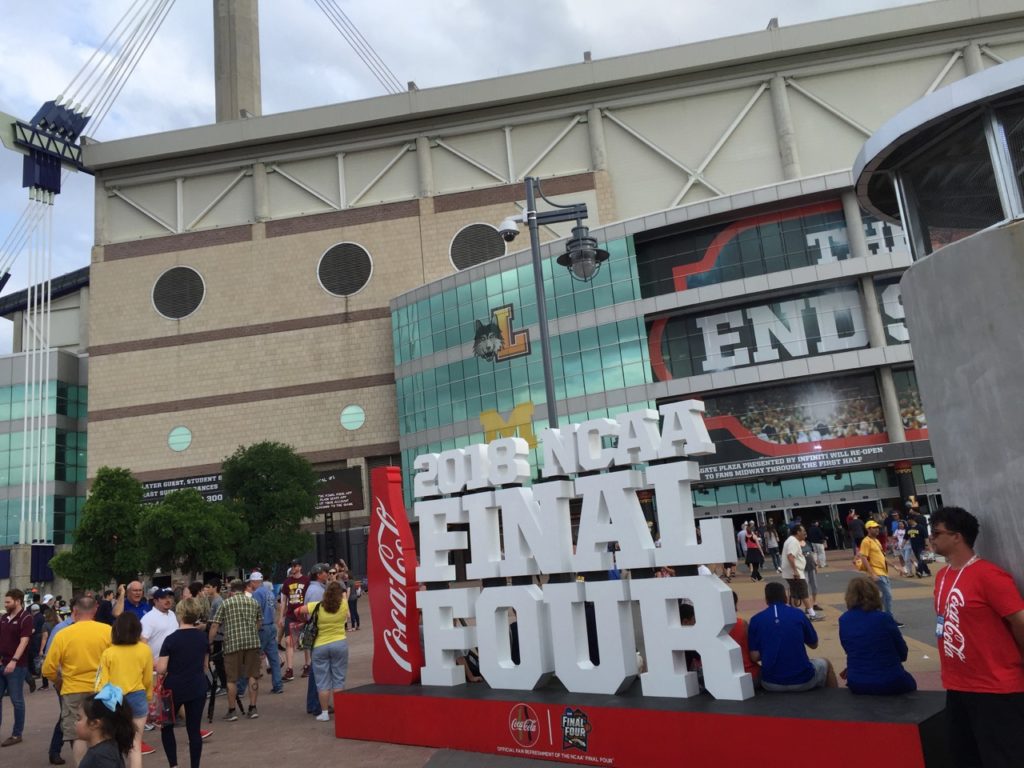
SAN ANTONIO, Texas — The new and temporary Wi-Fi networks inside the Alamodome were as hot as national champion Villanova Monday night, with many speedtest marks in the 50-60 Mbps range for both download and upload throughout many points in the stadium.

We’ll have more details and perhaps some final tonnage numbers coming soon, but before we crash late night here in the Alamo city, where Mobile Sports Report was live in attendance at Monday night’s championship game of the NCAA Men’s Basketball Tournament, we wanted to share some impressive stats we saw while logging numerous steps up and down the sections of the venerable Alamodome before and during Villanova’s 79-62 victory over Michigan.

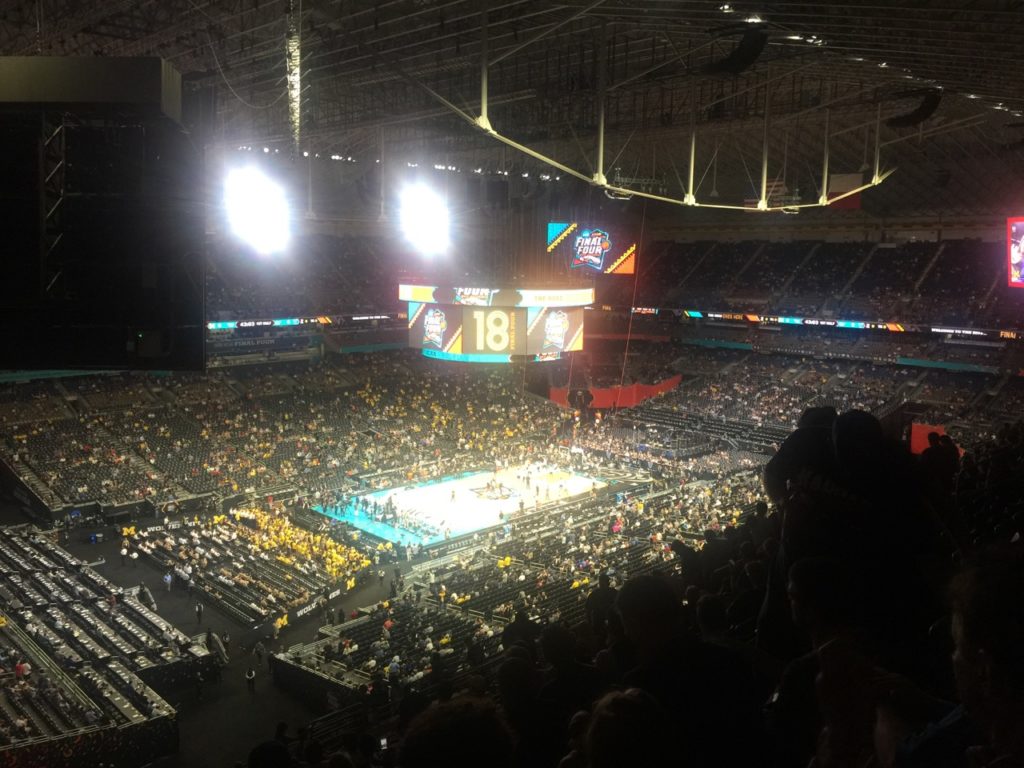
It was a pretty packed house with 67,831 in attendance Monday night, and for Wi-Fi it really was a tale of two networks: One, for the fixed or permanent seating in the football-sized facility, and another for the temproary network that serviced the wide expanse of floor seating brought in by the NCAA for its crown jewel event of men’s hoops. With about 200-plus Wi-Fi APs serving the closest seating sections, we still saw some super-healthy speedtest readings, like one of 55.9 Mbps download and 58.7 Mbps upload in the north stands in row DD, just past the band section and media sections behind the north hoop.

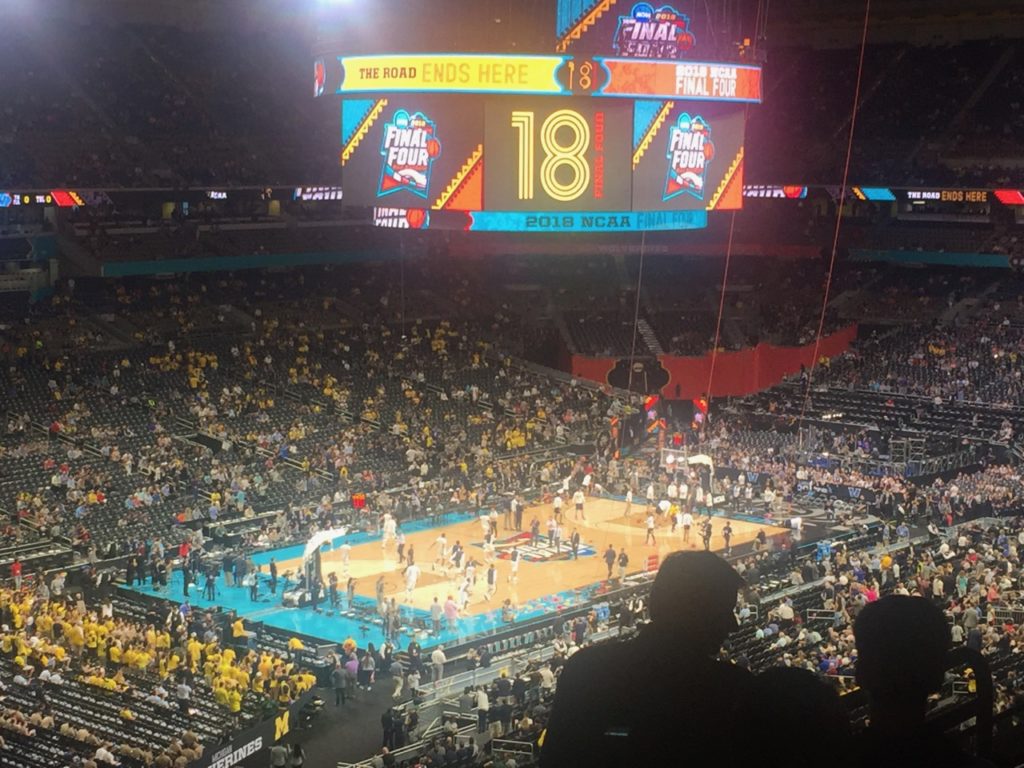
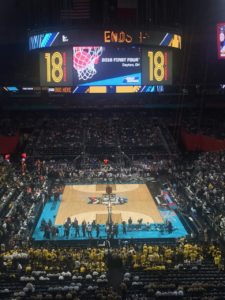
A good look at the court from the north end on the 300 level concourse

At center court on the side where the network broadcast teams sit, we got a speedtest of 34.3 Mbps down and 34.3 Mbps up in row JJ of section 112. Since we thought we heard Jim Nantz calling our name during pregame activities we scrambled down to row J, but Jim was called away before we could confirm his question. Instead we took a speed test there in the celeb seats and got an official mark of 1.65 Mbps / 7.61 Mbps, but did see a 10 Mbps download mark appear on a second test before the speedtest app encountered an error.

As far as we could tell, whatever designer and deployer AmpThink did for the on-floor seats it seemed to work pretty well. But as we are writing this that network is being dismantled, perhaps not to be used again until next year’s men’s Final Four, scheduled to take place at U.S. Bank Stadium in Minneapolis.

Handrail enclosures and Gillaroos

Up in the permanent seats, the network AmpThink installed during a permanent renovation of the Alamodome earlier also performed well, even in some of the hardest places to reach. At the top of the lower-bowl seating section, where MSR took a peanut break in the first half (since our media seat was, ironicially, the only place in the stadium where we couldn’t get any kind of a Wi-Fi connection) we got a mark of 65.6 Mbps / 62.5 Mbps.

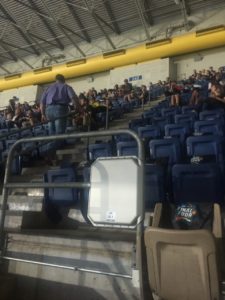
A handrail Wi-Fi AP enclosure in one of the higher seating sections.

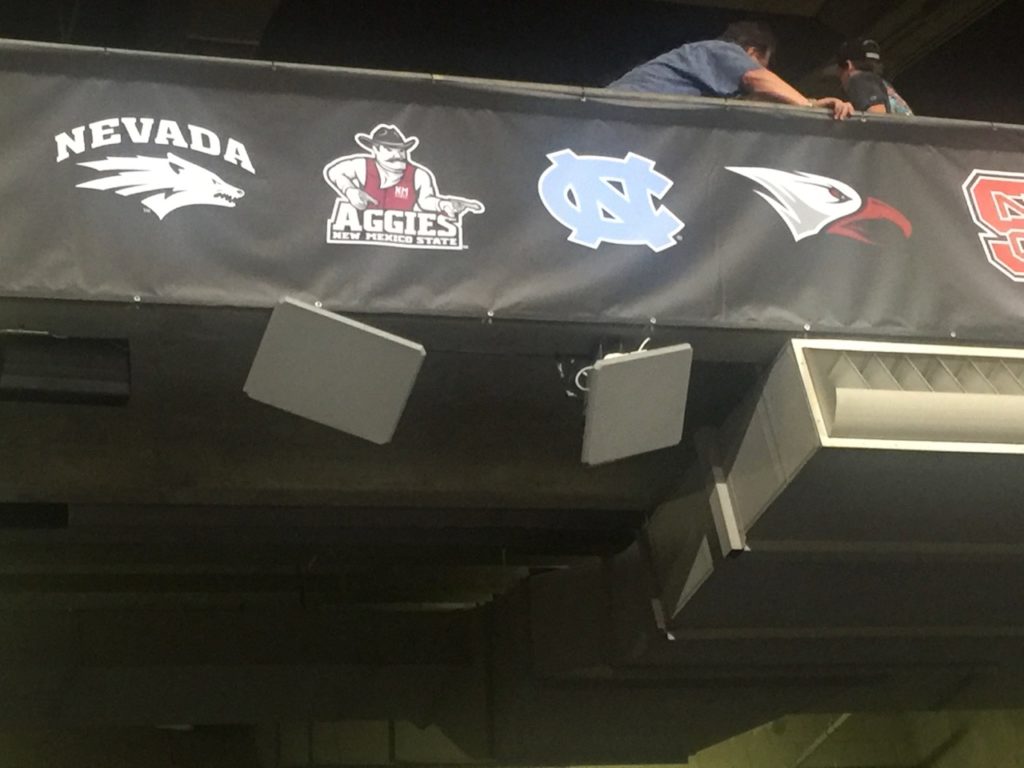
But even when we climbed into serious nosebleed country — and we do mean climb since the Alamodome has no escalators anywhere for fans — we still got good Wi-Fi connectivity, thanks in part to some handrail AP enclosures we saw above the VOMs leading to the top-section seats, and some Gillaroo antennas on the upper back walls pointing down. Above the VOM leading to section 343 in the stadium’s northwest corner we got a mark of 30.5 Mbps / 20.8 Mbps, and up near the roof in row 22 of section 342 we still got a mark of 17.5 Mbps / 9.84.

Other places where coverage really shined was in the stairwells and on the concourses; along the top-level 300 section concourse we got a pregame mark of 57.1 Mbps / 58.2 Mbps even as crowds chanting “Go Blue!” and “Nova Nation!” made traffic an elbow-to-elbow affair. In another stairwell, we stopped to catch our breath and got a speed test of 64.9 Mbps / 68.2 Mbps.

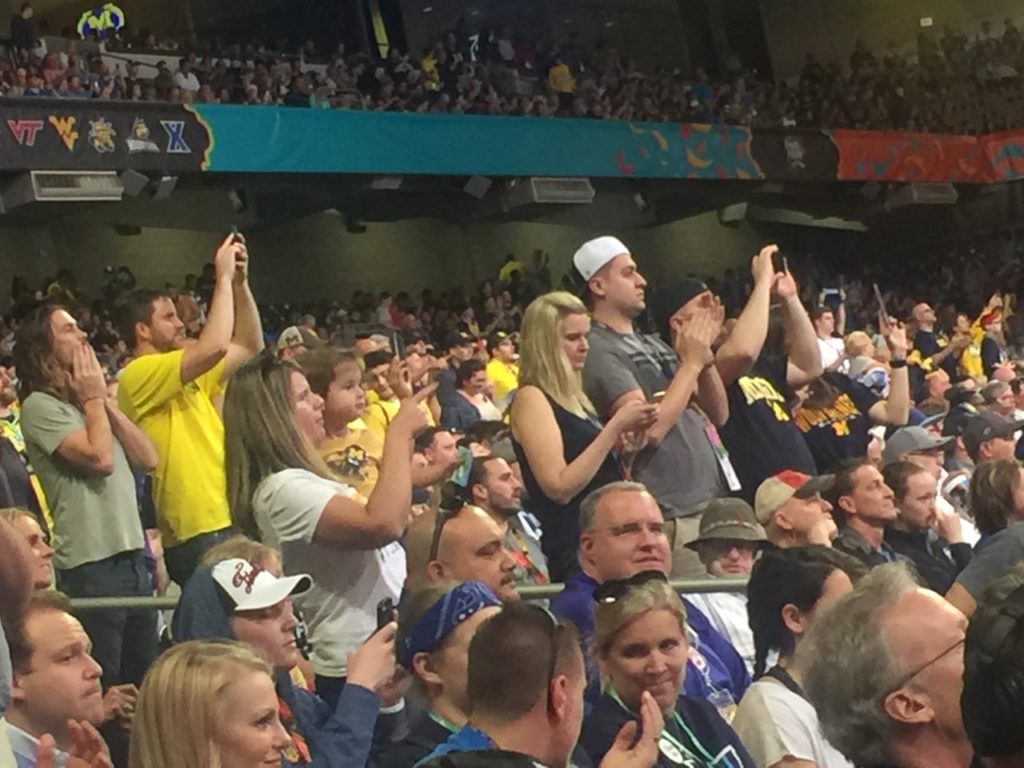
Overall, the permanent and temporary networks seemed to have performed well under the pressure of a bucket-list event, the kind where fans roam the concourses during pregame with phones overhead, taking videos to be shared later. According to Nicholas Langella, general manager for the Alamodome, preliminary reports said there were 12,500 unique connections to the Wi-Fi during Saturday’s semifinal games and another 12,300 connections during Monday’s championship game. On the DAS side of things, AT&T reported 2 terabytes of data used on their network during Saturday’s semifinals, and another 1.1 TB used during Monday’s game. We are still waiting for other carriers to report DAS numbers, as well as for final total Wi-FI usage numbers. For now enjoy some more photos from our visit.
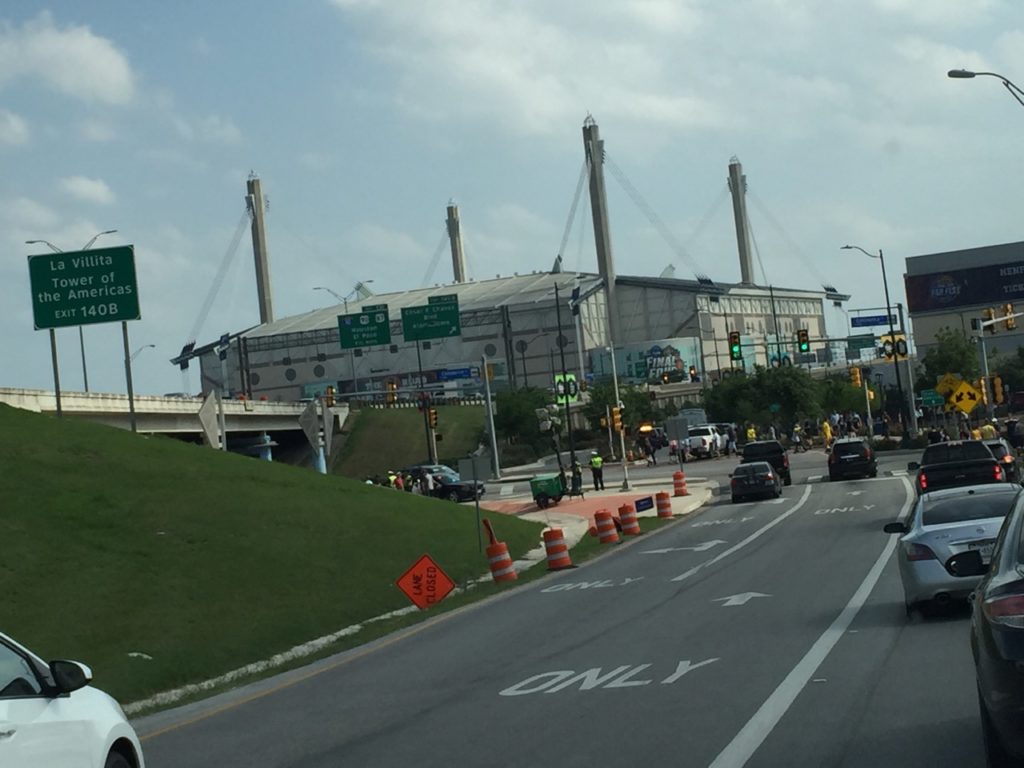

Approaching the Alamodome from the freeway

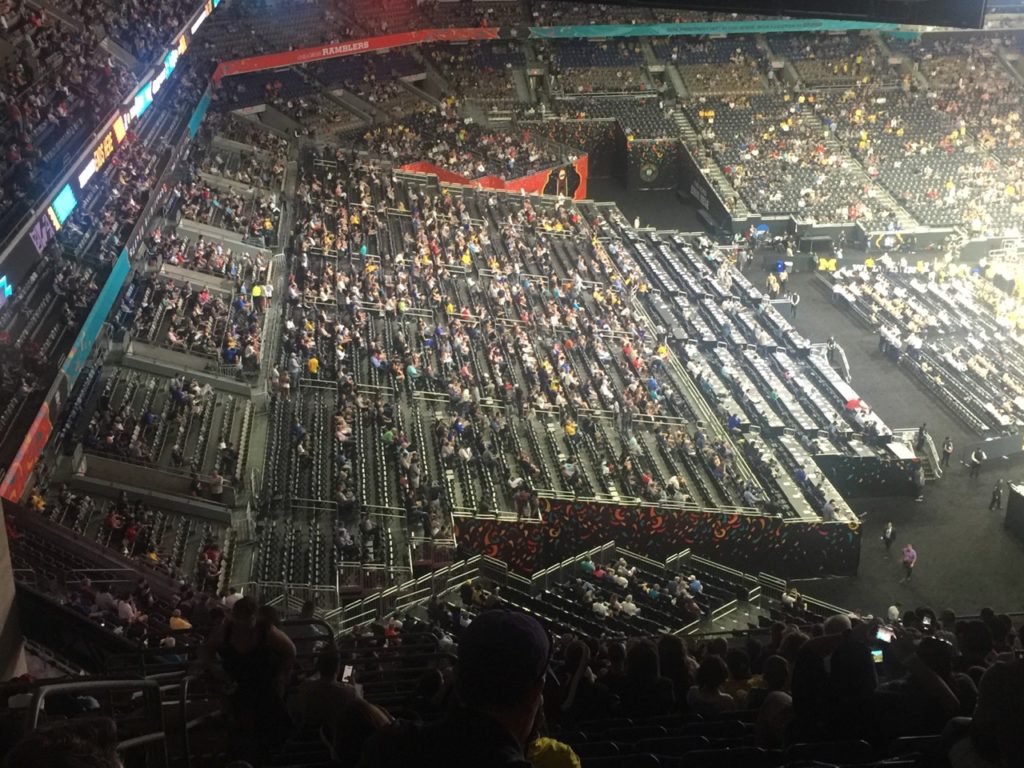
A good look at how the NCAA floor seats extend out in the end zone area

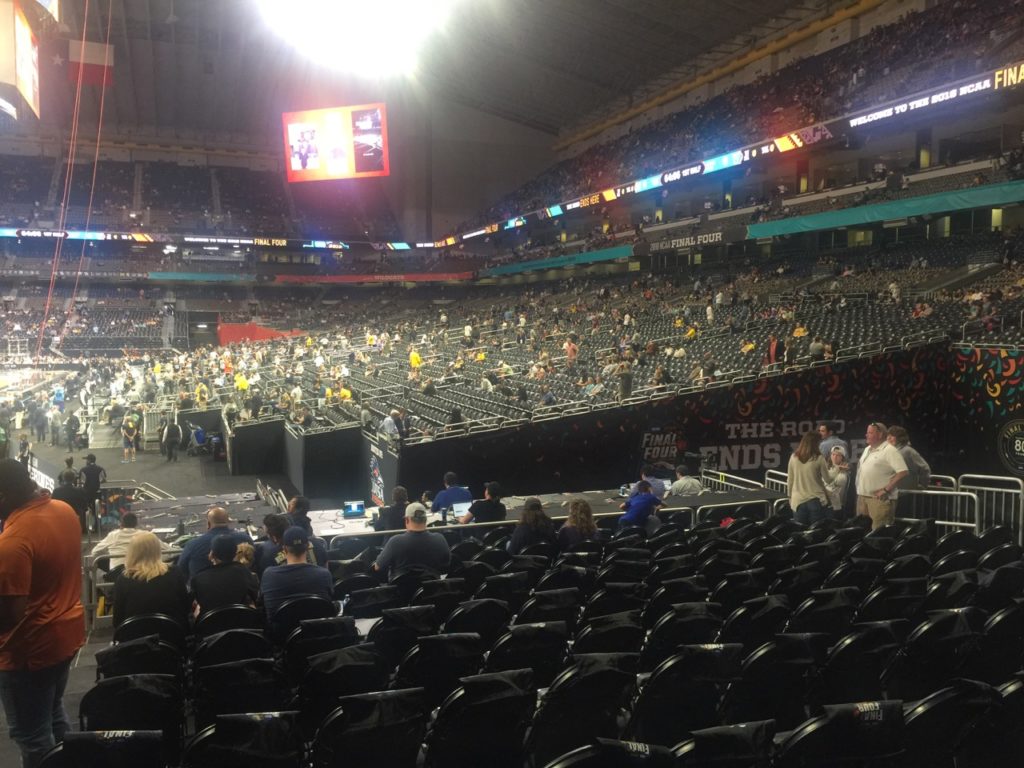
Another look at the floor seating sections, this time along courtside

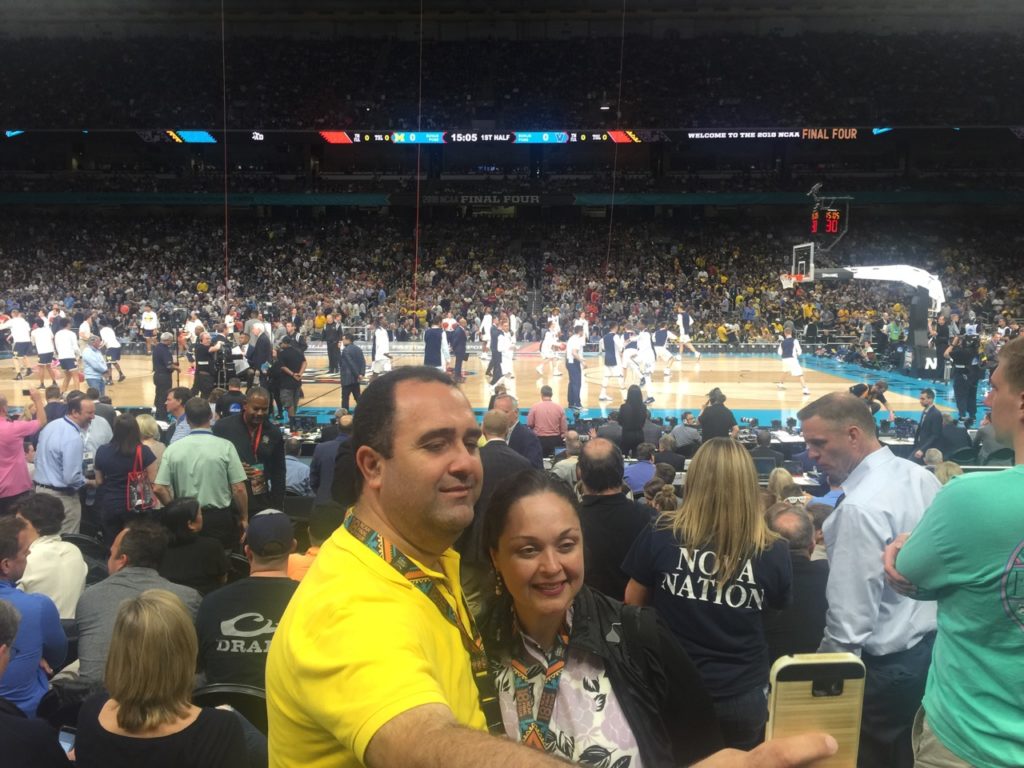
Courtside is selfie city

Gillaroos on overhangs in the permanent seating section

Zoomed in for a good look at the court

The human eye view from the same spot

Picture taking is the primary activity pregame

In case you forgot which event you came to see
Average per-fan Wi-Fi use total jumps again at Super Bowl 52

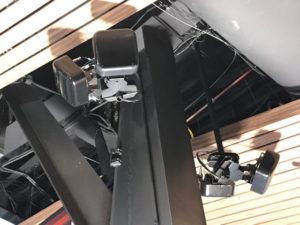
Seen in the main concourse at U.S. Bank Stadium: Two IPTV screens, one Wi-Fi AP and a DAS antenna. Credit: Paul Kapustka, MSR

After a year where the actual amount of average Wi-Fi data used per connected fan at the Super Bowl dropped, the trend of more data used per fan reversed itself again to a new peak at Super Bowl 52, with an average total of 407.4 megabytes per user.

Even though the number of unique connections to the Wi-Fi network at U.S. Bank Stadium for Super Bowl 52 also increased to a record 40,033 users (according to the official statistics compiled by Extreme Networks), the jump from 11.8 terabytes of Wi-Fi data used at Super Bowl 51 to 16.31 TB used at Super Bowl 52 pushed the average per-user number to the top, surpassing the 333 MB per user number from Super Bowl 51, as well as the 370 MB per user mark seen at Super Bowl 50.

While this statistic has not ever been called out by the Extreme Networks Super Bowl compilations, we here at MSR think it is a vital mark since it shows that even with more users on the network those connected users are still using more data. That means that IT departments at venues everywhere should probably still plan for no letup in the overall continued growth in demand for bandwidth at large-venue events, especially at “bucket list” events like the Super Bowl.

Last year we guessed the drop in per-user totals from Super Bowl 50 to Super Bowl 51 might have been due to a larger number of autoconnected users, but we never got an answer from the Extreme Networks team when we asked that question. At U.S. Bank Stadium there was also an autoconnect feature to the Wi-Fi for Verizon Wireless customers, but it didn’t seem to affect the per-user total mark.

Connectivity at the core of Little Caesars Arena, District Detroit

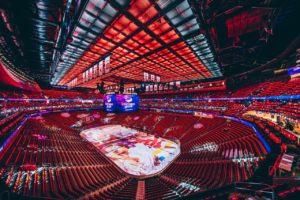
Little Caesars Arena, the new home for the Detroit Red Wings and the Detroit Pistons. Credit: Olympia Entertainment (click on any photo for a larger image)

Bringing great wireless connectivity to a new stadium is almost table stakes these days. But building up a nearby commercial district — and keeping connectivity high outside the venue’s walls — is a bet of another level, especially in Detroit where networks extend outside the new Little Caesars Arena into the 50-block District Detroit.

Following the arena’s opening in September of 2017, the prognosis so far is so far, so good, with solid reports of high network performance on both Wi-Fi and cellular networks in and around the new home of the NHL’s Detroit Red Wings and the NBA’s Detroit Pistons. But for John King, vice president of IT and innovation for venue owners Olympia Entertainment, the responsibilities for him and his network team extend far beyond the new stadium’s walls.

“We’re focused on the [wireless] signal not just in the bowl, but also in the surrounding elements — the streets, the outdoor arenas, and the Little Caesars Arena garage,” said King in an interview shortly after the arena opened. “The vision is, to be connected wherever you are. And to share that experience.”

An ambitious revival in downtown Detroit

Editor’s note: This profile is from our most recent STADIUM TECH REPORT for Winter 2018, which is available for FREE DOWNLOAD from our site. This issue has an in-depth look at the wireless networks at U.S. Bank Stadium in Minneapolis, as well as profiles of network deployments at the Las Vegas Convention Center and Orlando City Stadium! DOWNLOAD YOUR FREE COPY today!

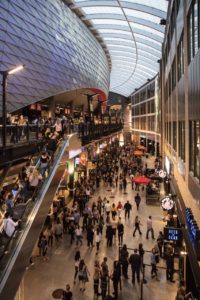
The inside concourse at Little Caesars Arena. Credit: Olympia Entertainment

Built nearby the Detroit Lions’ Ford Field and the Tigers’ Comerica Park, the new hoops/hockey stadium seats 19,515 for hockey and 20,491 for basketball. Unlike many stadiums of the past which rise up from the ground, Little Caesars Arena is built into the ground, 40 feet below street level. The innovations in construction and accessibility, including an outdoor arena adjacent to the indoor one, may require another full profile and an in-person visit. For now, we’ll concentrate on the wireless deployment in and around Little Caesars Arena, which was funded in part by a sponsorship from Comcast Business, which provides backbone bandwidth to the arena and the district in the form of two 100 Gbps connections. The Wi-Fi network design and deployment, done by AmpThink, uses Cisco Wi-Fi gear; Cisco’s Vision for Sports and Entertainment (formerly known as StadiumVision) is used to synchronize video output to the 1,500 TV screens located in and around the venue.

On the cellular side, Verizon Wireless built a neutral-host DAS, which was getting ready to welcome AT&T as the second carrier on board shortly after the opening. According to King, the Wi-Fi network has approximately 1,100 total APs both inside and outside the arena, many of those from Cisco’s 3802 series, which each have two radios per AP. For many of the 300 APs located in the main seating bowl, Little Caesars Arena went with an under-seat deployment, with some others placed in handrail enclosures, especially for the basketball floor-seating areas.

“AmpThink did a really nice job with the deployment,” said King, who said the arena’s open-air suite spaces helped provide “lots of flow” to wireless gear, without the historical overhangs around to block signals on different levels. One early visitor to the arena saw many Wi-Fi speed tests in the 50-60 Mbps range for both download and upload, as well as several in the 80-to-100 Mbps range, signs that a strong signal was available right at the start.

“We’ve still got a lot of tuning, but early on we’re getting great results,” said King of the Wi-Fi performance. “Our goal is to make it the best it can be.”

Staying connected outside the walls

Like The Battery area surrounding the Atlanta Braves’ new SunTrust Park, the District Detroit is meant to be a stay-and-play kind of space, with restaurants, clubs, office spaces and residences seeking to lure visitors and residents to do more than just see a game. For King and his team, one of their tasks is to ensure that visitors can stay connected no matter where they are inside the district, including inside restaurants, offices and other indoor spaces.

Connectivity blends well with the architecture inside Little Caesars Arena. Credit: Tod Caflisch, special to MSR

“We want the [network] signal to be robust, to carry into outdoor spaces, restaurants and many other areas” inside the District Detroit, King said. “We want to push the envelope a little bit and create a useful opportunity.”

Back inside Little Caesars Arena, the team and stadium apps are built by Venuetize, which built a similar integrated app for the Buffalo Bills and the Buffalo Sabres, one that also extends outside arenas to support connectivity in city areas. King said that Little Caesars Arena will be testing pre-order and express pickup concession ordering through the app, with a focus on seating areas that don’t have ready access to some of the club facilities.

Like any other new facility, Little Caesars Arena will no doubt go through some growing pains in its debut season, but for King and others who spent time getting the venue ready it’s fun to have the doors open.

“It’s really great seeing it all come to life,” King said.

Fans use 16.31 TB of Wi-Fi data during Super Bowl 52 at U.S. Bank Stadium

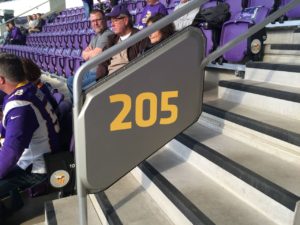
A Wi-Fi handrail enclosure at U.S. Bank Stadium in Minneapolis. Credit: Paul Kapustka, MSR (click on any photo for a larger image)

It is now official — we have a new record for most Wi-Fi data used at a single-day event, as fans at U.S. Bank Stadium in Minneapolis for Super Bowl 52 used 16.31 terabytes of data on the Wi-Fi network.

According to statistics compiled by Extreme Networks during the Philadelphia Eagles’ thrilling 41-33 victory over the New England Patriots Sunday night, the AmpThink-designed network which uses Cisco Wi-Fi gear also saw 40,033 unique users — 59 percent of the 67,612 in attendance — a new top percentage total for any single-game network experience we’ve been told about. (The Dallas Cowboys saw approximately 46,700 unique Wi-Fi users during a playoff game last season, about 50 percent of attendance at AT&T Stadium.)

The network also saw a peak concurrent connection of 25,670 users, and a peak data transfer rate of 7.867 Gbps, according to the numbers released by Extreme. Though Extreme gear was not used in the operation of the network, Extreme has a partnership deal with the NFL under which it provides the “official” network analytics reports from the Super Bowl.

The final total of 16.31 TB easily puts Super Bowl 52 ahead of the last two Super Bowls when it comes to Wi-Fi data use. Last year at NRG Stadium in Houston, there was 11.8 TB of Wi-Fi use recorded, and at Super Bowl 50 in 2016 there was 10.1 TB of Wi-Fi data used at Levi’s Stadium in Santa Clara, Calif. So in reverse chronological order, the last three Super Bowls are the top three Wi-Fi events, indicating that data demand growth at the NFL’s biggest game shows no sign of slowing down. Combined with the 50.2 TB of cellular data used in and around the stadium on game day, Super Bowl 52 saw a total of 66.51 TB of wireless traffic Sunday in Minneapolis.

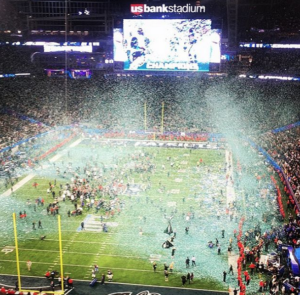
Confetti fills the air inside U.S. Bank Stadium after the Philadelphia Eagles defeated the New England Patriots in Super Bowl LII. Credit: U.S. Bank Stadium

Super Bowl 52 represented perhaps a leap of faith, in that the handrail-enclosure Wi-Fi design had not yet seen a stress test like that found at the NFL’s biggest event. Now looking ahead to hosting the 2019 Men’s NCAA Basketball Final Four, David Kingsbury, director of IT for U.S. Bank Stadium, can be forgiven for wanting to take a bit of a victory lap before we set our Wi-Fi sights on Atlanta’s Mercedes-Benz Stadium, home of Super Bowl 53.

“AmpThink, CenturyLink and Cisco designed and built a world-class wireless system for U.S. Bank Stadium that handled record-setting traffic for Super Bowl LII,’ Kingsbury said. “AmpThink president Bill Anderson and his team of amazing engineers were a pleasure to work with and the experts at Cisco Sports and Entertainment supported us throughout the multi-year planning process required for an event of this magnitude. High-density wireless networking is such a challenging issue to manage, but I am very happy with our results and wish the team in Atlanta the best next year. The bar has been raised.”

THE LATEST TOP 10 FOR WI-FI

1. Super Bowl 52, U.S. Bank Stadium, Minneapolis, Minn., Feb. 4, 2018: Wi-Fi: 16.31 TB
2. Super Bowl 51, NRG Stadium, Houston, Feb. 5, 2017: Wi-Fi: 11.8 TB
3. Super Bowl 50, Levi’s Stadium, Santa Clara, Calif., Feb. 7, 2016: Wi-Fi: 10.1 TB
4. Minnesota Vikings vs. Philadelphia Eagles, NFC Championship Game, Lincoln Financial Field, Philadelphia, Pa., Jan. 21, 2018: Wi-Fi: 8.76 TB
5. Kansas City Chiefs vs. New England Patriots, Gillette Stadium, Foxborough, Mass., Sept. 7, 2017: Wi-Fi: 8.08 TB
6. Green Bay Packers vs. Dallas Cowboys, Divisional Playoffs, AT&T Stadium, Arlington, Texas, Jan. 15, 2017: Wi-Fi: 7.25 TB
7. Southern California vs. Notre Dame, Notre Dame Stadium, South Bend, Ind., Oct. 21, 2017: 7.0 TB
8. WrestleMania 32, AT&T Stadium, Arlington, Texas, April 3, 2016: Wi-Fi: 6.77 TB
9. Super Bowl 49, University of Phoenix Stadium, Glendale, Ariz., Feb. 1, 2015: Wi-Fi: 6.23 TB
10. Georgia vs. Notre Dame, Notre Dame Stadium, South Bend, Ind., Sept. 9, 2017: Wi-Fi: 6.2 TB

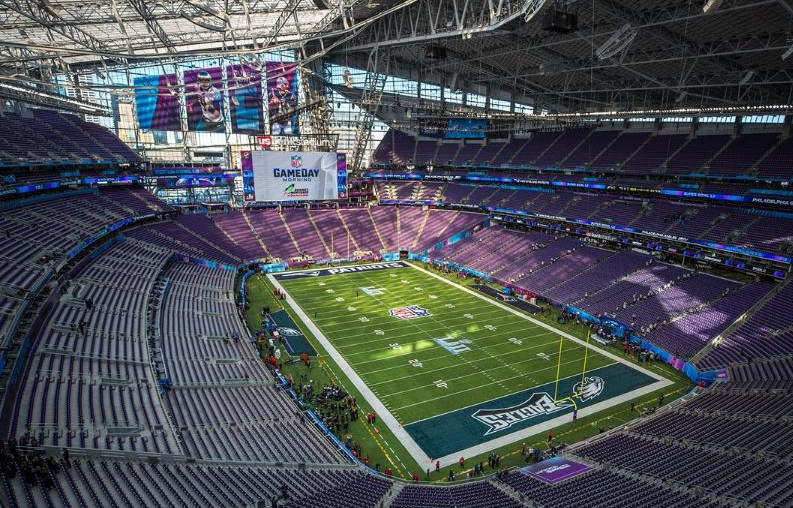
U.S. Bank Stadium in Minneapolis before the start of Super Bowl LII

Eagles see 8.76 TB of Wi-Fi data for NFC Championship game on new Panasonic network

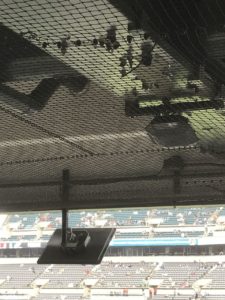
Panasonic Everest Wi-Fi APs (lower left, middle right) mounted underneath an overhang at Lincoln Financial Field in Philadelphia. Credit: Panasonic (click on any photo for a larger image)

The Philadelphia Eagles saw 8.76 terabytes of Wi-Fi data used at Lincoln Financial Field on Jan. 21 during the Eagles’ 38-7 win over the Minnesota Vikings in the NFC Championship game, a new high in one-day Wi-Fi usage for reported marks in games not called the Super Bowl.

Though the game’s position as No. 3 on our unofficial “top Wi-Fi” list (see below) may change as we get reports from other recent NFL playoff games, the mark is nevertheless impressive, and perhaps a big confirmation metric for Panasonic’s nascent big-venue Wi-Fi business. According to Panasonic, its 654-Access Point network inside “The Linc” also saw 35,760 unique connections during the game, out of 69,596 in attendance; the network also saw a peak of 29,201 concurrent devices connected (which happened during the post-game trophy presentation), and saw peak throughput of 5.5 Gbps.

What’s most interesting about the new Panasonic network in Philadelphia is that it is a completely top-down deployment, meaning that most of the APs (especially the 200 used in the seating bowl) shoot signals down toward seats from above. While most new networks at football-sized stadiums (and some smaller arenas) have turned to under-seat or railing-mounted APs to increase network density in seating areas, Panasonic claims its new “Everest” Wi-Fi gear has antennas that can provide signals up to 165 feet away, with “electronically reconfigurable directional beam profiles” that allow for specific tuning of where the Wi-Fi signal can point to.

By also putting four separate Wi-Fi radios into each access point, Panasonic also claims it can save teams and venues money and time on Wi-Fi deployments, since fewer actual devices are needed. By comparison, other big, new network deployments like Notre Dame’s often have a thousand or more APs; Notre Dame, which uses railing-mounted APs in the seating bowl, has 685 in the seating bowl out of a total 1,096 APs. Many of the Notre Dame APs are Cisco 3800 devices, which have two Wi-Fi radios in each AP.

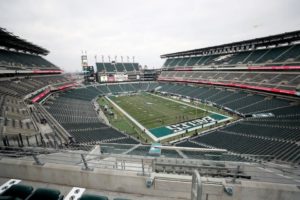
‘The Linc’ before last week’s NFC Championship game. Credit: Kiel Leggere, Eagles

Atlanta’s new Mercedes-Benz Stadium, which uses Aruba Wi-Fi gear mainly deployed under seats in the bowl, has nearly 1,800 APs, with 1,000 of those in the seating bowl.

Antennas close to fans vs. farther away

From a design and performance standpoint, the under-seat or railing-mounted “proximate” networks are built with many APs close together, with the idea that fans’ bodies will intentionally soak up some of the Wi-Fi signal, a fact that network designers use to their advantage to help eliminate interference between radios. The under-seat AP design, believed to be first widely used by AT&T Park in San Francisco and then at a larger scale at Levi’s Stadium in Santa Clara, Calif., was developed to help bring better signals to seats where overhang-mounted APs couldn’t deliver strong connectivity. Older concrete-bowl stadiums like Notre Dame’s also went with a proximate railing design for a similar lack of overhangs.

Though the Eagles’ IT team has repeatedly turned down interview requests from MSR since this summer, Danny Abelson, vice president connectivity for Panasonic Enterprise Solution Company, met with MSR last week to provide details of the deployment. Citing new, patented antenna technology developed specifically by Panasonic to solve the limitations of prior overhead gear, Abelson claims Panasonic can deliver a similar stadium experience for “two-thirds the cost” of an under-seat or railing-mount network design, with savings realized both in construction costs (since it is usually cheaper to install overhead-mounted equipment than under-seat or railing mounts due to drilling needed) and in the need for fewer actual APs, since Panasonic has four radios in its main Wi-Fi APs.

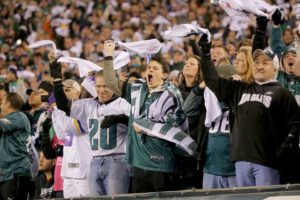
Eagles fans cheering their team to the Super Bowl. Credit: Hunter Martin, Eagles

Abelson, however, declined to provide the exact cost of the Panasonic network at Lincoln Financial Field, citing non-disclosure agreements. There are also more questions to be answered about a Panasonic deployment’s cost, including charges for management software and/or administration services. Currently, Abelson said, Panasonic includes the costs for management software and management personnel in its bids.

When it comes to how the Eagles found Panasonic, the team and the company already had an existing relationship, as Panasonic’s video-board division had previously supplied displays for the Linc. According to Abelson, Panasonic went through a performance test at several Eagles games last season, bringing in Wi-Fi gear to see if the new technology could provide coverage to areas where the Eagles said they had seen lower-quality coverage before. One of the forerunners in the NFL in bringing Wi-Fi to fans, the Eagles had previously used Extreme Networks Wi-Fi gear to build a fan-facing network in 2013. Though the Eagles would not comment about the selection process, after issuing an RFP this past offseason the team chose Panasonic for a new network, which Abelson said was deployed in three months during the football offseason.

Re-opening the debate for antenna placement?

Though Mobile Sports Report has not yet been able to get to Philadelphia to test the new network in a live game-day situation, if Panasonic’s new gear works as promises the company may find many potential interested customers, especially those who had shied away from deploying under-seat networks due to the construction issues or costs.

The Panasonic system may be of particular interest to indoor arenas, like hockey and basketball stadiums, where the gear could be potentially mounted in catwalk areas to cover seating. John Spade, CTO for the NHL’s Florida Panthers and BB&T Center in Sunrise, Fla., has tweeted favorably about a Panasonic deployment going in at the arena whose networks he oversees:

But even as the impressive 8.76 TB mark seen at the NFC Championship game now sits as the third-highest reported Wi-Fi data use event we’ve heard of (behind only the 10.1 TB of Wi-Fi seen at Super Bowl 50 and the 11.8 TB seen at Super Bowl 51), that number may fall a bit down the list if we ever get verified numbers for some network totals we’ve heard rumors about lately. (Or even any older ones! C’mon network teams: Check out the list below and let us know if we’ve missed any.)

So far this season, we haven’t gotten any reports of Wi-Fi usage out of the network team at Atlanta’s Mercedes-Benz Stadium (which recently hosted the college football playoff championship game), and we’ve only heard general talk about oversized playoff-game traffic at U.S. Bank Stadium in Minneapolis, home of Sunday’s Super Bowl 52. Like Notre Dame Stadium, U.S. Bank Stadium uses a mostly railing-mounted AP deployment in its seating bowl; both networks were designed by AmpThink. We are also still waiting for reports from last week’s AFC Championship game at Gillette Stadium, where the previous non-Super Bowl top mark of 8.08 TB was set in September; and from any games this fall at AT&T Stadium in Arlington, Texas, where the NFL’s biggest stadium has 2,567 Wi-Fi APs.

Will overhead still be able to keep up as demand for more bandwidth keeps growing? Will Panasonic’s claims of lower costs for equal performance hold up? At the very least, the performance in Philadelphia could re-open debate about whether or not you need to deploy APs closer to fans to provide a good Wi-Fi experience. If all goes well, the winners in renewed competition will be venues, teams, and ultimately, fans.

THE LATEST TOP 10 FOR WI-FI

1. Super Bowl 51, NRG Stadium, Houston, Feb. 5, 2017: Wi-Fi: 11.8 TB
2. Super Bowl 50, Levi’s Stadium, Santa Clara, Calif., Feb. 7, 2016: Wi-Fi: 10.1 TB
3. Minnesota Vikings vs. Philadelphia Eagles, NFC Championship Game, Lincoln Financial Field, Philadelphia, Pa., Jan. 21, 2018: Wi-Fi: 8.76 TB
4. Kansas City Chiefs vs. New England Patriots, Gillette Stadium, Foxborough, Mass., Sept. 7, 2017: Wi-Fi: 8.08 TB
5. Green Bay Packers vs. Dallas Cowboys, Divisional Playoffs, AT&T Stadium, Arlington, Texas, Jan. 15, 2017: Wi-Fi: 7.25 TB
6. Southern California vs. Notre Dame, Notre Dame Stadium, South Bend, Ind., Oct. 21, 2017: 7.0 TB
7. WrestleMania 32, AT&T Stadium, Arlington, Texas, April 3, 2016: Wi-Fi: 6.77 TB
8. Super Bowl 49, University of Phoenix Stadium, Glendale, Ariz., Feb. 1, 2015: Wi-Fi: 6.23 TB
9. Georgia vs. Notre Dame, Notre Dame Stadium, South Bend, Ind., Sept. 9, 2017: Wi-Fi: 6.2 TB
10. Alabama vs. Texas A&M, Kyle Field, College Station, Texas, Oct. 17, 2015: Wi-Fi: 5.7 TB

San Jose Sharks add more features to SAP Center stadium app

The San Jose Sharks announced today a raft of upgrades to their stadium app, including a feature that will allow fans to toggle through four separate modes of functionality, for Sharks games, SAP Center events, minor-league hockey info and information about the Sharks-associated public skating rinks in the area.

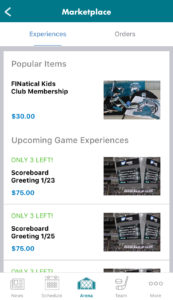
Now called the San Jose Sharks + SAP Center app, the mobile-device program developed by VenueNext and Adept Mobile will bring to life some previously mentioned services for Sharks fans, including the ability to order Sharks merchandise and in-stadium “experiences” — like purchasing a message on the big video board — directly from the app.

Screen shot of new ‘marketplace’ options in Sharks app

Other new features include live audio broadcasts of Sharks games and games for the AHL’s Barracuda; augmented reality experiences; and a message preference and inbox feature that will allow fans to self-regulate the frequency of in-app communications with the team.

The ability to toggle between different versions of the app — say, for Sharks hockey games or for a concert at SAP Center — is a feature finding its way into most stadium apps these days, including VenueNext’s app for the San Francisco 49ers and Levi’s Stadium. The Sacramento Kings have a similar two-apps-in-one strategy for the team and for Golden 1 Center, in an app developed by Built.io.

For fans, it’s a way to have all the arena-going information in one place, while for the teams and venues it’s a way to keep current customers informed of all the associated businesses. (On its face the feature sounds like a smart idea, but so far we haven’t seen any metrics from any teams showing proof that it is really working for either fans or teams/venues.)

Putting the ability to order experiences like big-screen messages (just $75!) or visits from the Shark’s toothy mascot into the app seems like a good idea, since those actions can now be acted on in the moment instead of having to plan far ahead. And for fans who like to hear play by play either at the rink or at home, having team audio is a great feature and alternative to radio.