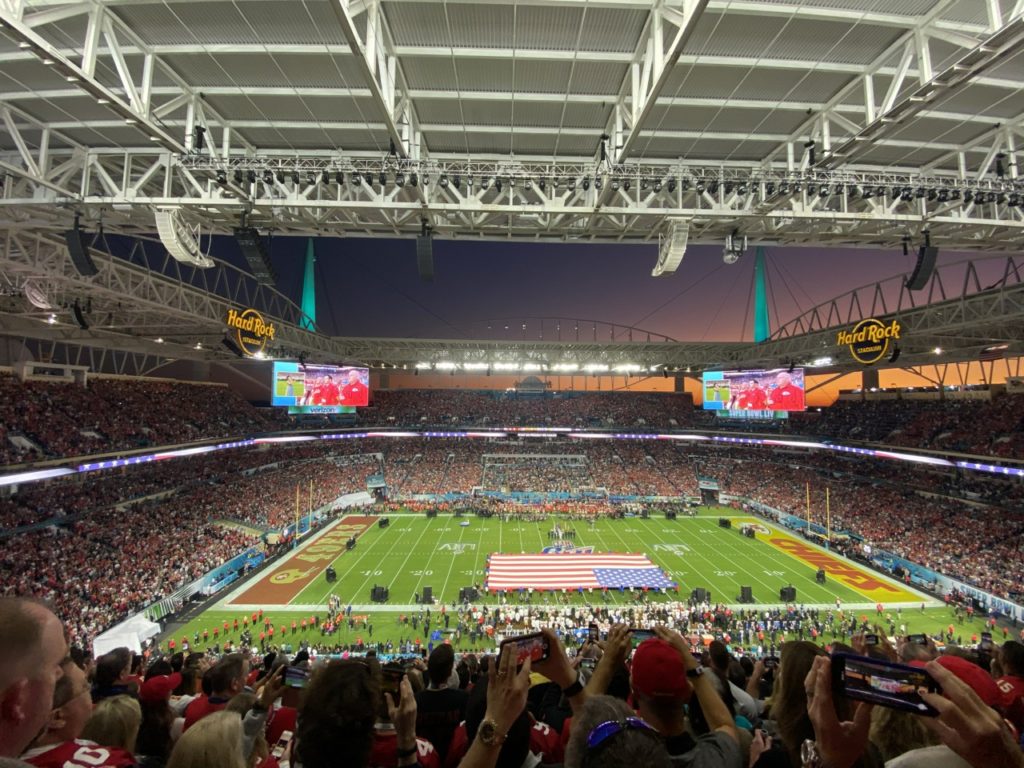
Miami’s Hard Rock Stadium hosted Super Bowl LIV this year, where the new single-day Wi-Fi record was set. Credit: Brian Nitenson, MSR
What’s most interesting (to us) about the number is that it was generated in a venue that had approximately 8,000 fewer fans in attendance than last year’s Super Bowl (70,081 in Atlanta for Super Bowl 53 vs. 62,417 for Super Bowl 54). It was also the second-lowest Super Bowl attendance figure ever, just above the 61,946 fans who attended Super Bowl 1.
So not surprisingly the fans who connected to the Wi-Fi network at Miami’s Hard Rock Stadium also set a new record for average data consumed per connected user, at 595.6 megabytes per user — a big jump from last year’s average data per user total of 492.3 MB. Going forward, we here at MSR think this statistic is even more important than the overall data-used or total tonnage mark, since it more accurately reflects how the network is performing for fans.
“I think the average [data] per user is the metric we’re most proud of,” said John Brams, director of sports and entertainment for Extreme Networks. Extreme, which has a sponsorship deal with the NFL to provide network statistics from every Super Bowl, was also the gear provider for the network at Hard Rock Stadium, the first Super Bowl for Extreme gear since Super Bowl 51 at Houston’s NRG Stadium back in 2017. According to Extreme, the Wi-Fi setup at Hard Rock Stadium uses some 2,000 APs, many of which are deployed in under-seat enclosures in the bowl seating.
The average data used per device, Brams said, is to Extreme the proof of how well each user is served by the network, and is perhaps a more important metric than the simple total of data used.
“If you are asking what is the health of a network, the average [data used] per user is a good metric for that,” Brams said. Brams, like MSR, also believes that the average data used per user is a metric that can be used to compare network performances between different-sized stadiums, like football stadiums and basketball arenas, which might be very far apart in total data used simply because of the capacity differences.
Verizon autoconnect helps out on the Wi-Fi usage
Editor’s note: This profile is from our latest STADIUM TECH REPORT, which is available to read instantly online or as a free PDF download! Inside the issue is a profile of Dickies Arena in Fort Worth and a recap of a DIY Wi-Fi deployment at Rutgers University! Start reading the issue now online or download a free copy!
With a reported 44,358 unique devices connected to the network this year’s Super Bowl also set a new mark for Super Bowl take rate at 71 percent; the top overall take rate mark still belongs to Ohio State, which saw 71.5 percent of its fans connected when Ohio Stadium saw 25.6 TB of Wi-Fi used this past fall during a game against Michigan State. It’s worth noting that the average data per user mark from the Ohio State game was 341.6 MB.
Like at Ohio State, at Hard Rock Stadium fans whose devices were on a Verizon cellular subscription could be automatically connected to the Wi-Fi network, a factor that often results in high take rates. Verizon has similar deals with a number of NFL stadiums and some large college venues, including Ohio State, Florida and Brigham Young. Verizon would not reveal what percentage of its customers were included in the overall unique Wi-Fi connection number at Super Bowl LIV.Peak network usage hits 10 Gbps
Some more info from the great list put together by Extreme: The peak concurrent user number of 24,837 devices was seen during pre-game activities; the peak network throughput of 10.4 Gbps also occurred before the game started, according to Extreme. Of the final data total, 11.1 TB was used before the game started, with the balance of 15.32 TB being used after kickoff.
“We’ve seen the highest data rates right before the game started at the last four Super Bowls,” said Brams. According to Brams, this statistic may be caused by the fact that people at Super Bowls tend to arrive very early for the games, and by the NFL’s attempts to keep things interesting with plenty of pregame entertainment.
The most used streaming apps by fans at Super Bowl LIV were, in order of usage, Apple iTunes, Apple Streaming, YouTube, Spotify and Netflix; the most used social apps in order of usage were Facebook, Instagram, Twit- ter, Snapchat and Bitmoji. For sports apps, the most used in order of usage were ESPN, NFL, NFL OnePass, CBS Sports and ESPN Go.
When reading through the list of apps, MSR wondered out loud who would be watching Netflix at a Super Bowl. But Brams thinks Extreme’s network statistics have an answer.
“It’s amazing how many people bring kids to a big game,” he said. “And those kids may not be that interested in everything going on at the game, so in between they are streaming shows [on Netflix].” Brams said the Netflix-at-games is a trend at NFL games in general, with Netflix consistently showing up in the top 5 of apps used on a stadium network.
A view of the field just before kickoff. Credit: Brian Nitenson, MSR
